
A Practitioner's Guide to the Analysis of Movement
Team Meloq
Author
The analysis of movement is the systematic observation of how an individual moves to identify both efficiencies and potential dysfunctions. For practitioners in physiotherapy and sports performance, it is analogous to a diagnostic check for a high-performance engine. The goal is to identify subtle inefficiencies that could lead to injury or limit an individual's physical potential. Understanding these movement patterns is a foundational step in designing effective rehabilitation or training programs.
Why Analyzing Human Movement Is Foundational
The human body can be viewed as a complex biomechanical system. Every action, from walking to an explosive athletic movement, follows a specific kinetic and kinematic sequence. When this sequence is optimal, movement is fluid, powerful, and safe. However, minor deviations—such as a subtle pelvic drop during running or an asymmetrical landing from a jump—can initiate a cascade of compensatory actions that may lead to issues over time.
These subtle dysfunctions are often imperceptible without a trained eye and systematic approach. An athlete might report feeling "off," or a patient may present with recurrent, non-specific pain. Without a structured analysis of movement, clinicians are often left to speculate about the root cause. By deconstructing complex movements into their constituent parts, practitioners can pinpoint where the kinetic chain is breaking down.
Beyond Guesswork to Guided Intervention
A robust analysis elevates clinical practice from conjecture to precision. It provides the "why" behind a patient's pain or an athlete's performance ceiling. Instead of applying a generic protocol, practitioners can design highly specific interventions that address the identified fault.
- Injury Prevention: Identifying at-risk movement patterns, such as excessive knee valgus during landing tasks, allows for proactive correction before an injury occurs (1).
- Rehabilitation: Objective tracking of movement quality post-injury is critical for facilitating a safe and effective return to activity, significantly reducing the risk of re-injury.
- Performance Optimization: Fine-tuning an athlete's technique with biomechanical data can unlock greater power, speed, and efficiency.
A core principle in biomechanics is that the body follows the path of least resistance. Movement analysis helps determine why that path may have become faulty and provides a roadmap for guiding it back toward an optimal route, thereby restoring function and building resilience.
This process is a cornerstone of evidence-based practice, transforming clinical observation into actionable insights. It serves as the foundation for superior physical performance testing. For example, a detailed analysis of a squat might reveal limited ankle dorsiflexion. This single impairment could be the underlying cause of compensation higher up the kinetic chain, contributing to knee or low back pain (2). Addressing the ankle limitation directly provides a more effective and sustainable solution than simply treating the symptomatic area.
Understanding The Pillars Of Movement Analysis
A comprehensive analysis of movement requires looking beyond what is visible to the naked eye. A single action is a symphony of biomechanical and neurological events occurring in precise coordination. In physiotherapy and sports science, this is typically deconstructed into three core pillars. Each provides a unique perspective on human motion, and only by integrating insights from all three can we form a complete picture.
This infographic illustrates how movement analysis serves as a bridge between understanding injury risk and unlocking performance potential.
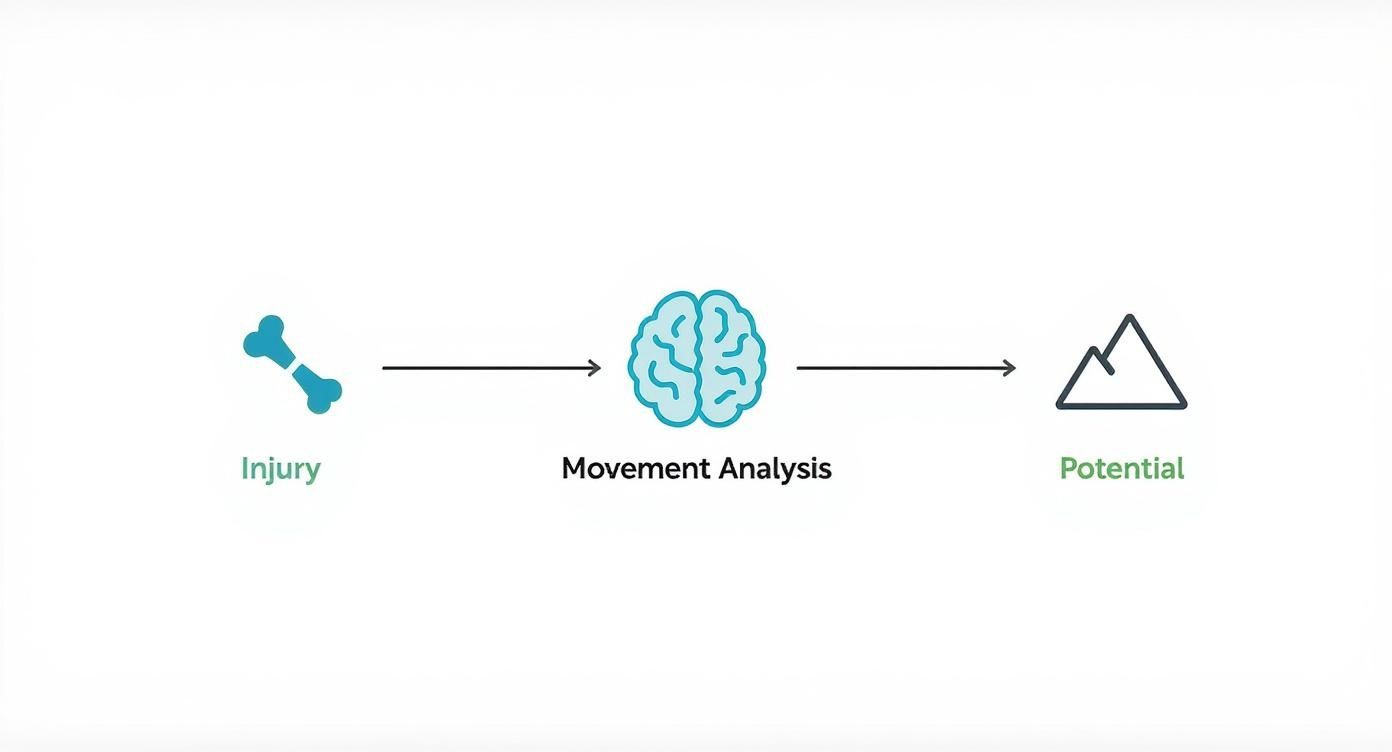
As the visual depicts, a thorough analysis is the central hub for identifying factors that may predispose an individual to injury or, conversely, uncovering the keys to their peak physical capabilities. To delve deeper, the table below breaks down these three foundational components, explaining what each measures and its practical application.
Core Components of Movement Analysis
A summary of the fundamental pillars involved in a comprehensive analysis of human movement.
| Component | What It Measures | Practical Example |
|---|---|---|
| Kinematics | The geometry of motion (angles, speeds, distances) without considering the forces involved. | Measuring the precise angle of a pitcher's elbow at ball release or the peak height achieved in a vertical jump. |
| Kinetics | The forces that cause movement (e.g., ground reaction forces, joint torques, muscle power). | Analyzing the ground reaction force an athlete produces during a jump or the rotational torque at the knee during a cutting maneuver. |
| Motor Control | The nervous system's role in planning, coordinating, and executing movement. | Observing how a gymnast adjusts their landing strategy mid-air or how a patient's gait pattern changes with neuromuscular fatigue. |
By examining movement through these distinct but interconnected lenses, practitioners can build a complete and actionable understanding of an individual's movement health.
Kinematics: The Geometry Of Motion
The first pillar is kinematics, which describes the geometry of movement. It focuses on the motion itself without regard for the forces that produce it. Kinematics addresses questions of "what," "where," "how fast," and "in what direction."
For example, a kinematic analysis of a basketball player's jump shot would focus on:
- The angle of the elbow at the moment of ball release.
- The velocity of arm extension.
- The trajectory of the ball as it leaves the hand.
These are observable and measurable qualities of the movement. Kinematics provides a clear picture of the movement strategy an individual employs.
Kinetics: The Physics Behind The Action
While kinematics describes what happened, kinetics explains why it happened by examining the forces involved. This includes internal forces generated by muscles and external forces acting on the body, such as gravity and ground reaction forces.
Returning to the basketball player, a kinetic analysis would investigate:
- The ground reaction force generated to initiate the jump.
- The joint torque (rotational force) created at the shoulder and elbow.
- The impact forces absorbed upon landing.
Jump mechanics studies have demonstrated the critical role these forces play in both performance and injury risk (3). Without assessing kinetics, practitioners are working with an incomplete picture.
A crucial insight: Two movements can appear kinematically identical yet be driven by vastly different kinetic strategies. One individual might perform a squat with efficient force distribution, while another uses a high-risk force profile that could increase joint stress over time.
Motor Control: The Neurological Software
The final pillar, motor control, can be conceptualized as the "software" directing the movement. It encompasses the complex processes by which the brain and nervous system organize and command muscles to produce coordinated, purposeful actions.
Motor control allows our basketball player to unconsciously adjust their shot based on a defender's position or to correct their balance in mid-air. It is the distinction between the often-uncoordinated movements of a novice and the seemingly effortless fluidity of an elite athlete. This pillar relates to how the central nervous system recruits the appropriate muscles, in the correct sequence, and with the optimal magnitude of force.
When motor control is suboptimal, inefficient movement patterns and compensations emerge, placing undue stress on certain tissues. By integrating kinematics, kinetics, and motor control, clinicians and coaches can conduct a truly comprehensive analysis of movement that leads to safer and more effective outcomes.
References
- Hewett TE, Myer GD, Ford KR, Heidt RS Jr, Colosimo AJ, McLean SG, et al. Biomechanical measures of neuromuscular control and valgus loading of the knee predict anterior cruciate ligament injury risk in female athletes: a prospective study. Am J Sports Med. 2005;33(4):492-501.
- Macrum E, Bell DR, Boling M, Lewek M, Padua D. Effect of limiting ankle-dorsiflexion range of motion on lower extremity kinematics and muscle-activation patterns during a squat. J Sport Rehabil. 2012;21(2):144-50.
- Laffaye G, Wagner PP, Tombleson T. Countermovement jump height: gender and sport-specific differences in the force-time variables. J Strength Cond Res. 2014;28(4):1096-105.
Choosing Your Tools: From Clinical Eye to Lab Tech
Movement analysis methods range from qualitative clinical observation to quantitative, lab-grade technology. The foundation of any assessment is qualitative observation—the "clinical eye" developed through years of practice. This skill allows a practitioner to rapidly identify subtle asymmetries, compensatory patterns, and movement dysfunctions.
This initial observation forms a working hypothesis. For instance, a physical therapist observing a runner may note a pelvic drop on one side with each step, immediately suggesting potential gluteus medius weakness or a motor control deficit. This observation initiates the entire assessment process.
However, even the most experienced eye has limitations. It cannot quantify forces or analyze movements that occur in milliseconds. This is where quantitative tools become invaluable, serving as powerful extensions of clinical reasoning. They provide objective, repeatable data to confirm, refute, or refine initial observations.
Augmenting Observation with Objective Data
Quantitative tools do not replace clinical skill; they enhance it. They provide the distinction between "it appears to be" and "it is." The observed pelvic drop can be measured as a specific number of degrees and tracked over time to objectively demonstrate the efficacy of an intervention. This objective evidence is critical for justifying treatment plans and enhancing client adherence.
A simple and accessible starting point is video analysis, often requiring nothing more than a smartphone.
- Slow-Motion Playback: Recording a jump or gait in slow motion reveals kinematic details invisible in real-time.
- Frame-by-Frame Analysis: This allows for the precise identification of key events, such as peak knee flexion during landing or the moment of initial contact in walking.
- Drawing Tools: Many applications allow users to draw lines and measure angles directly on the video, providing simple but effective kinematic data.
This blend of qualitative insight and quantitative measurement creates a much fuller picture. Technology provides the "what"—the hard data—while the practitioner provides the "why"—the clinical context and interpretation.
As a practitioner's needs evolve, understanding the range of various analysis technologies available is key. Moving beyond simple video leads to more specialized instruments that offer deeper insights into both kinematics and kinetics.
Advanced Tools for Deeper Insights
For clinicians seeking to understand the forces behind movement, more advanced systems are necessary. These tools measure kinetics and neuromuscular function that cannot be captured by video alone.
3D Motion Capture Systems are widely considered the gold standard for kinematic analysis. Using multiple cameras to track reflective markers placed on the body, these systems create a detailed 3D biomechanical model of movement. This provides highly accurate data on joint angles and segment velocities in all three planes of motion. While historically confined to research laboratories, more accessible versions are becoming increasingly common in high-performance clinical settings.
Force Plates provide direct insight into kinetics. These instruments measure the ground reaction forces an individual generates when standing, walking, or jumping.
During a jump-landing assessment, force plates can reveal:
- Asymmetries in Landing Force: An athlete recovering from an ACL injury may unconsciously offload their involved limb. A force plate can quantify this potentially hazardous compensation pattern.
- Rate of Force Development (RFD): This metric indicates how rapidly an individual can generate force, serving as a key indicator of explosive power and neuromuscular function.
- Landing Strategy: Force plates can quantify impact absorption strategies, providing crucial data for injury prevention programs.
Data from force plate testing can be transformative, especially in return-to-play decision-making. It provides objective evidence that an athlete can not only move well but can also safely manage the high-impact forces inherent in their sport.
What To Measure: Key Metrics In Movement Analysis
Having the right tools is only part of the equation; knowing what to measure is critical. A successful analysis of movement involves translating complex human motion into clear, objective metrics. These metrics serve as the language for understanding injury risk, tracking progress, and optimizing physical potential. This data-driven approach allows for the identification of subtle inefficiencies often missed by the naked eye, providing a solid foundation for targeted and effective interventions.
Kinematic Metrics: The Geometry of How We Move
Kinematics describes the "what" and "where" of a movement pattern without considering the forces involved. These metrics are often visually intuitive and form the basis of many movement screens.
A fundamental kinematic metric is joint angles. Measuring the angle of a joint at a key phase of movement—such as peak knee flexion during a jump landing—provides direct insight into movement strategy and potential injury risk. For instance, research has consistently linked aberrant knee kinematics to increased strain on the anterior cruciate ligament (ACL) (1). By quantifying this, a practitioner can move from a subjective observation like "the landing looks stiff" to an objective statement that an athlete's peak knee flexion is 15 degrees below an optimal range, creating a measurable target for intervention.
Other key kinematic measures include:
- Velocity: The speed of a limb or the entire body, crucial for assessing explosive power in athletes or gait speed in clinical populations.
- Displacement: The distance and direction a body part moves, useful for analyzing jump height or runner's stride length.
Kinetic Metrics: The Forces Behind The Action
While kinematics describes movement, kinetics explains why it occurs by measuring the underlying forces. This level of analysis is particularly powerful for understanding invisible stresses and power outputs.
The cornerstone of kinetic analysis is Ground Reaction Force (GRF), measured with force plates. GRF quantifies the interaction between an individual and the ground, providing raw data on force production and absorption for every step, jump, and change of direction. For an athlete recovering from ankle surgery, visual assessment might suggest symmetrical jumping. However, force plate data could reveal they are still offloading their involved limb by 25%, flagging a compensation pattern that increases re-injury risk.
An essential kinetic metric is the Rate of Force Development (RFD), which measures how quickly an athlete can generate force. A high RFD is characteristic of elite athletic performance, while a low RFD can indicate neuromuscular fatigue or deficits that require intervention.
The table below provides a breakdown of some of the most essential metrics used in clinical and performance settings.
Essential Metrics in Movement Analysis
A breakdown of key quantitative metrics, their significance, and practical applications in physiotherapy and sports performance.
| Metric | Definition | Clinical Relevance |
|---|---|---|
| Joint Angles | The angle formed between two body segments at a joint. | Essential for assessing technique, identifying at-risk movement patterns (e.g., knee valgus), and monitoring range of motion. |
| Velocity | The rate of change of position; how fast something is moving. | Key for evaluating explosive power in athletes (e.g., jump velocity) and functional mobility in patients (e.g., gait speed). |
| Ground Reaction Force (GRF) | The force exerted by the ground on a body in contact with it. | Crucial for understanding force production/absorption, identifying limb asymmetries, and informing return-to-sport decisions. |
| Rate of Force Development (RFD) | How quickly an individual can generate peak force. | A primary indicator of explosive strength, neuromuscular efficiency, and readiness for high-intensity activity. |
| Limb Symmetry Index (LSI) | A percentage comparison of performance between two limbs. | A standard metric for quantifying asymmetries post-injury, guiding rehabilitation goals, and clearing athletes for return to play. |
Putting these metrics into practice allows for the creation of a complete, evidence-based picture of an individual's movement capabilities.
Symmetry and Asymmetry: A Balancing Act
Finally, a comprehensive analysis must assess limb symmetry. The human body is adept at compensating for weakness or injury by developing subtle but significant asymmetrical patterns. Quantifying the performance difference between limbs is a powerful diagnostic tool.
The Limb Symmetry Index (LSI) is a calculation used to compare the performance of one limb relative to the other, typically expressed as a percentage. It can be applied to various metrics:
- Peak Force: Is one leg producing significantly more force than the other during a bilateral jump?
- RFD: Can both legs generate force at a similar rate?
- Landing Impulse: Is one leg absorbing a disproportionate amount of impact force?
Clinicians often use a threshold of 90% symmetry or higher as one criterion for clearing an athlete to return to sport. Failure to meet this benchmark suggests that underlying deficits persist, even if the movement appears visually normal. Combining these force metrics can also provide a deeper understanding of an athlete’s capabilities. To learn more, check out our guide on how to calculate the Dynamic Strength Index, which compares maximal strength to explosive strength.
References
- Hewett TE, Myer GD, Ford KR, Heidt RS Jr, Colosimo AJ, McLean SG, et al. Biomechanical measures of neuromuscular control and valgus loading of the knee predict anterior cruciate ligament injury risk in female athletes: a prospective study. Am J Sports Med. 2005;33(4):492-501.
Applying Movement Analysis In Practice

This section demonstrates how the principles, tools, and metrics of movement analysis are applied in real-world scenarios. A systematic analysis of movement makes the invisible visible, transforming clinical hypotheses into concrete strategies that directly impact an individual’s health and performance.
Case Study One: A Runner With Patellofemoral Pain
A common clinical presentation is a recreational runner with patellofemoral pain syndrome (PFPS). Initial visual assessment may reveal dynamic knee valgus—an inward collapse of the knee during the stance phase of gait. While this qualitative observation is a useful starting point, quantitative data is needed to understand the extent of the issue.
Using slow-motion video analysis, the exact angle of knee collapse can be measured. If this angle is found to be greater than 10 degrees, it confirms a significant deviation from optimal mechanics. This kinematic data often correlates with weakness in the hip abductors, such as the gluteus medius, which are responsible for maintaining pelvic stability in the frontal plane.
Further assessment using a functional test like the sit-to-stand can provide data on lower body strength and control. Comparing the client's performance to established benchmarks adds another layer of objective information. This multi-faceted approach transforms a vague complaint of "runner's knee" into a specific diagnosis of poor frontal plane control, leading directly to a targeted hip-strengthening program. You can learn more about the data behind this test in our guide to Sit to Stand Test Norms.
Case Study Two: ACL Return-To-Sport Protocol
Clearing an athlete for return to sport following ACL reconstruction is a high-stakes decision. A premature return significantly increases the risk of re-injury. In this context, a comprehensive movement analysis is non-negotiable.
The process begins with assessing basic movement patterns but must progress to quantitative testing using tools like force plates. An athlete may appear strong and feel confident, but significant deficits in force production and absorption can persist long after surgery.
A critical objective criterion for return to sport is achieving a limb symmetry index (LSI) of at least 90% on key functional tests, such as single-leg vertical jumps. This ensures the surgically repaired limb can perform at 90% or more of the capacity of the uninjured limb.
A force plate analysis during a drop jump test can reveal:
- Peak Landing Force: Is the athlete still favoring their uninjured leg?
- Time to Stabilization: How quickly can they regain balance? A delay suggests poor neuromuscular control.
- Rate of Force Development: Can they generate explosive power symmetrically?
If data reveals a force production LSI of only 75%, the athlete is objectively not prepared for the demands of their sport. This quantitative feedback removes subjectivity and provides a clear, defensible benchmark for safer return-to-play decisions.
Case Study Three: Optimizing A Throwing Motion
In performance settings, movement analysis is used to maximize output while minimizing injury risk. Consider a baseball pitcher seeking to increase fastball velocity. The analysis of movement here focuses on identifying kinematic inefficiencies that lead to energy leaks.
Using 3D motion capture, a biomechanist can analyze the entire throwing sequence. The analysis might reveal that the pitcher's pelvis rotates too early relative to their upper torso. This suboptimal sequencing disrupts the kinetic chain, forcing the shoulder and elbow to overcompensate, which can both reduce velocity and increase injury risk. Armed with this insight, a coach can implement specific drills to improve hip-and-torso separation. Subsequent testing can objectively measure improvements in rotational timing, directly linking mechanical adjustments to performance gains. This demonstrates how, beyond the clinic, the critical role movement analysis plays in sports is about unlocking potential while building more resilient athletes.
Debunking Common Movement Analysis Myths
As movement analysis becomes more accessible, several myths have emerged. These misconceptions can lead practitioners to misinterpret valuable data, resulting in flawed conclusions. Addressing these myths is essential for applying the analysis of movement effectively.
Myth 1: There's a Single "Correct" Way to Move
One persistent myth is the notion of a single "perfect" form for any given movement. While biomechanical principles provide guidelines for safety and efficiency, human movement is inherently variable. Factors such as individual anatomy, training history, and anthropometry result in a wide spectrum of effective movement solutions. Forcing an individual with a specific hip structure into a "textbook" squat, for example, could be counterproductive and potentially harmful (1). The goal should be to find an optimal and safe pattern for the individual, not to enforce a universal template.
Myth 2: More Tech Automatically Means Better Analysis
Another common pitfall is the assumption that more advanced technology guarantees a better analysis. While tools like force plates and 3D motion capture provide rich data, their value is entirely dependent on the expertise of the interpreter. Without clinical context and a clear understanding of the metrics, objective data is merely noise.
Objective data is intended to inform, not replace, clinical reasoning. The practitioner's expertise is what translates quantitative outputs—like joint angles or ground reaction forces—into an actionable, individualized plan.
Myth 3: Normative Data Is a Rigid Rulebook
There is often confusion regarding the application of normative data—the average values derived from population studies. While these values provide a useful reference point for contextualizing an individual's performance, they should not be treated as rigid benchmarks that every person must achieve.
To ensure a sound analysis, adhere to these principles:
- Context is King: Always interpret data within the context of the individual's goals, injury history, and the specific demands of their activity.
- Variability is Normal: Recognize that natural movement variability is not necessarily a flaw. The aim is often to identify an optimal range of movement, not a single, rigid pattern.
- Data Supports Decisions: Use quantitative data to confirm or challenge clinical hypotheses. It is a powerful guide, not a standalone diagnostic tool.
By moving past these myths, practitioners can leverage movement analysis to guide and empower their clients, remembering that the focus is on treating the individual, not just the numbers.
References
- Kemp J, Schache AG, Makdissi M, Sims K, Crossley K. Greater hip- and knee-flexion excursion distinguishes athletes who report no hip/groin problems from those who do. Am J Sports Med. 2013;41(1):126-34.
Your Questions Answered: Movement Analysis in Practice
This section addresses common questions from practitioners about implementing movement analysis in a clinical or performance setting.
How Can I Start Implementing Movement Analysis With a Limited Budget?
Meaningful analysis of movement does not require an expensive laboratory. The most valuable tool is a practitioner's clinical eye, supported by a repeatable process. Start by refining qualitative observation skills, perhaps using simple checklists to ensure consistency.
The slow-motion video feature on any modern smartphone is a powerful and low-cost tool that allows you to:
- Analyze Kinematics: Break down fast movements frame by frame to observe details invisible in real time, such as a runner's foot position at initial contact.
- Identify Asymmetries: Easily spot differences between the left and right sides of the body during movements like a squat or jump.
- Track Progress: Record videos at different stages of a program to provide clear visual evidence of improvement for both the practitioner and the client.
Free analysis applications are also available that allow for the measurement of joint angles directly on videos, providing an entry point into quantitative analysis without significant financial investment.
Is Quantitative Data More Important Than My Clinical Judgment?
No. Quantitative data and clinical judgment are partners in the assessment process. The data provides objective, unbiased facts that can either confirm clinical intuition or prompt further investigation. Your clinical judgment gives that data meaning. The numbers may describe what is happening, but your expertise is required to understand why it matters for that specific individual. For instance, data showing a 15% asymmetry in jump height between limbs requires a skilled practitioner to place that number in the context of the person's injury history, sport, and goals to develop an effective plan.
The most effective approach integrates objective data with sound clinical reasoning. Technology provides the evidence, but the practitioner provides the wisdom.
How Do I Avoid Getting Overwhelmed By All The Data?
To avoid "paralysis by analysis," begin each assessment with a clear, specific question. A common error is attempting to measure everything at once, which can lead to a confusing dataset. Instead, adopt a focused approach. Rather than a vague goal like "analyze the jump," ask a targeted question such as, "Does this athlete demonstrate symmetrical force absorption upon landing?" This immediately narrows the focus to a few key metrics, such as ground reaction force and time to stabilization for each leg. This approach makes the data more digestible and the insights clearer. As your skills develop, you can begin to layer in more complexity.
Ready to swap subjective guesswork for objective data? The Meloq ecosystem of portable, accurate measurement tools—including our EasyForce dynamometer, EasyAngle digital goniometer, and EasyBase force plate—is built to empower practitioners like you. Visit the Meloq homepage to see how our devices can help you quantify movement, track progress, and deliver superior outcomes for your clients and athletes.

Featured Product
EasyForce Digital Dynamometer
Handheld muscle strength testing with 99% accuracy. Used in 40+ peer-reviewed studies.
Learn More