
A Clinician's Guide to the Normative Data Definition
Team Meloq
Author
Imagine a growth chart for a child, which tracks their height against their peers. Now, apply that same concept to tracking an athlete’s recovery after an injury. That's the core idea behind normative data. Simply put, normative data provides a set of standardized scores drawn from a specific, representative population, giving clinicians a crucial baseline for comparison.
What Is Normative Data and Why It Matters in Rehabilitation

In the world of physiotherapy and sports performance, normative data serves as a roadmap. It transforms subjective observations like, "the athlete seems stronger," into objective, measurable facts. This shift allows clinicians to move beyond guesswork and anchor their decisions in solid evidence.
Let's consider a practical example. Say you are assessing a 25-year-old male soccer player's quadriceps strength after ACL surgery. How do you objectively determine what "strong enough" is for a safe return to play? Normative data can provide an answer by offering a benchmark derived from a large sample of healthy soccer players in a similar age group.
This context is the foundation for several of our most important clinical tasks.
Setting Clear and Realistic Goals
Without a clear target, rehabilitation can feel unstructured for both the clinician and the patient. Normative data helps illuminate the path. It provides evidence-based answers to critical questions like:
- What is the typical shoulder range of motion for a healthy individual of this age and activity level?
- What is the average grip strength for someone with a similar background?
By setting goals based on this type of data, we can build a structured recovery plan that is both logical and effective. This approach not only enhances treatment but also helps manage patient expectations and keeps them motivated with clear milestones. This data-driven process is deeply connected to the principles covered in our guide on the biomechanics of sport and exercise.
Objectively Measuring Progress
Progress in rehabilitation is not always linear or immediately obvious. A patient might become frustrated by a perceived lack of improvement, even when they are making steady, underlying gains. This is where normative data becomes a powerful tool for demonstrating progress.
By comparing a patient's current measurements—be it jump height, balance, or muscle force—to their previous results and established norms, you can create a visual and objective story of their improvement. This data-backed feedback is invaluable for maintaining patient engagement and confidence in their recovery plan.
At its core, normative data is derived from large, representative samples of a population, which helps establish what a "normal" range looks like for a given measurement. We then use this as our yardstick. If an individual's measurement falls within the typical range—often defined as within one or two standard deviations of the average—it is generally considered within normal limits. A value outside this range may signal a need for further investigation, a concept detailed in foundational clinical research.
Key Concepts of Normative Data at a Glance
To make this clearer, let's break down the essential components of normative data and why each is vital in a clinical setting.
| Concept | Simple Explanation | Why It Matters for Clinicians |
|---|---|---|
| Baseline | A "starting point" measurement taken from a large group of similar individuals. | It provides an objective target for rehabilitation, moving beyond guesswork. |
| Population Sample | The specific group of people the data was collected from (e.g., 20-30 year old female volleyball players). | You must compare your patient to the right group. Comparing a 65-year-old's data to that of a 20-year-old is not appropriate. |
| Mean (Average) | The average score of the population sample. | This is the center of the "normal" range and the primary reference point. |
| Standard Deviation | A number that shows how spread out the data is from the average. | It helps define the boundaries of what is considered a typical or normal score. |
| Percentile Rank | Shows where an individual's score falls in relation to everyone else in the sample (e.g., 75th percentile means they scored higher than 75% of the group). | It’s an easy-to-understand way to communicate progress and standing to patients. |
This table serves as a quick reference. Understanding these elements empowers us to use normative data effectively to guide recovery, manage expectations, and ultimately, achieve better outcomes for our patients.
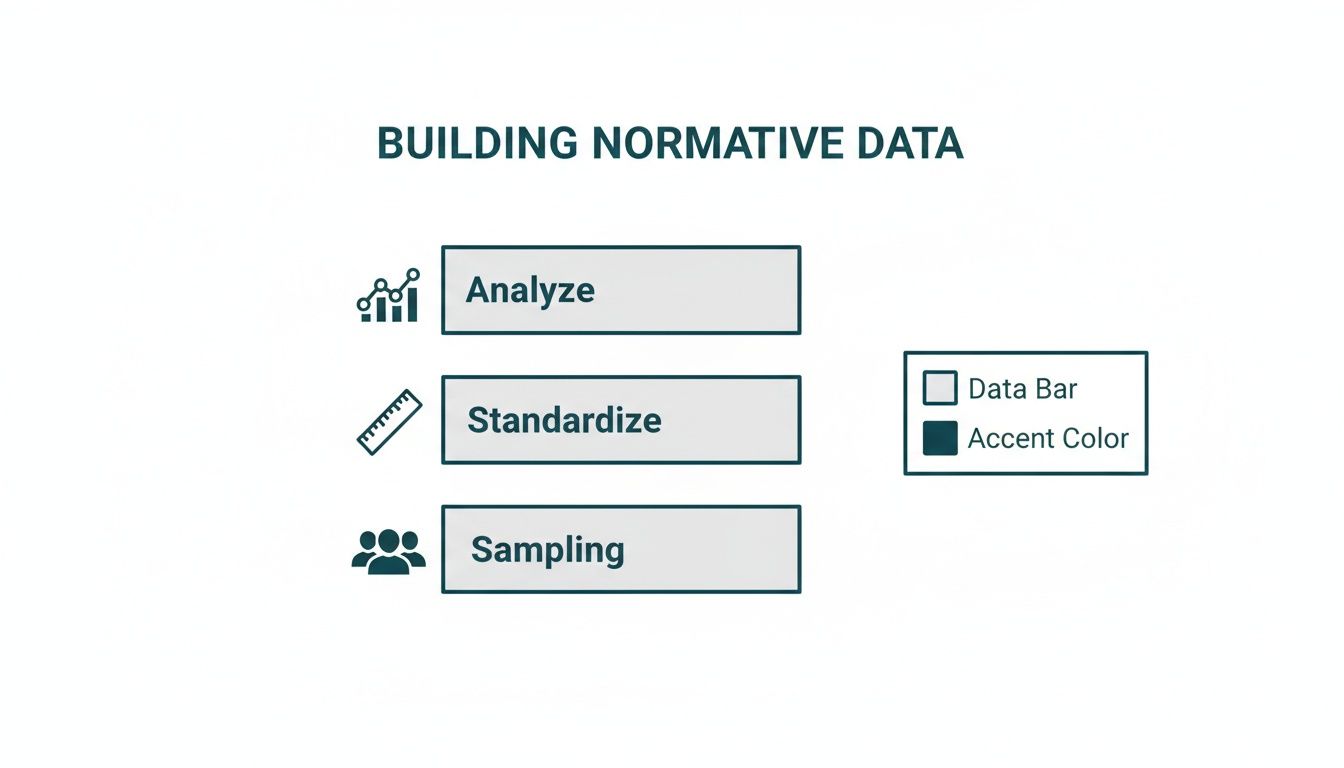
How a Reliable Clinical Benchmark Is Built
High-quality normative data does not appear out of thin air; it is the product of a rigorous scientific process. Creating a trustworthy, precise, and genuinely useful benchmark for patient care requires meticulous planning and execution.
The entire process is built on one core principle: standardization. Every instruction, measurement, and environmental factor must be consistent for every participant. Without this level of control, the data can become unreliable. It is similar to a track and field event—if every athlete started at a different line or ran on a different surface, their times would be meaningless for comparison.
The Critical Role of Sampling
The first step is selecting the right participants. This process, known as sampling, is arguably the most crucial stage. The goal is to gather a group of individuals who truly represent the patient population you intend to measure.
For example, to establish knee extension strength norms for post-ACL reconstruction patients, the sample should not include professional weightlifters or sedentary older adults. It must consist of individuals who precisely match that target demographic. This ensures the final benchmark is relevant and applicable in a real-world clinical setting.
A one-size-fits-all dataset is a significant clinical pitfall. To create useful, stratified norms, key demographic variables must be accounted for. These typically include:
- Age: Strength, flexibility, and balance change predictably across a lifespan.
- Gender: Physiological differences often have a significant impact on performance metrics.
- Activity Level: An elite athlete’s physical capacity will differ vastly from that of a recreational walker.
- Sport or Occupation: Specific physical demands create unique adaptations that need to be considered.
By carefully curating a representative sample, researchers ensure the resulting normative data is both accurate and fair when applied to an individual patient.
Standardized Protocols Are Non-Negotiable
Once the right group is assembled, the next step is to ensure every test is performed in exactly the same way. Standardized testing protocols are the rulebook that guarantees consistency and enables valid comparison. This means defining everything—from the patient’s starting position and the specific instructions they receive to the equipment used for measurement.
This methodological rigor is what gives the final data its validity and representativeness. When every assessment is performed under the same controlled conditions, we can be confident that we are comparing like with like. This allows for the creation of large-scale datasets that are contextually appropriate across diverse groups—a cornerstone of fair and effective evaluations. We explore these methods in more detail in our guide on the principles of physical performance testing.
The collection and application of normative data involve careful methodological design to ensure the validity of outcomes. Analysis typically contrasts an individual's performance against a standard derived from a representative sample tested under standardized conditions. You can discover more insights about this normative data analysis on minicoursegenerator.com.
Appreciating the immense effort that goes into proper sampling and protocol standardization makes one a more discerning consumer of research. It empowers you to critically evaluate the source of your data and apply it with confidence to make better, more informed decisions for your patients. This is the foundational knowledge that separates guessing from evidence-based practice.
Making Sense of the Numbers in Clinical Practice
While statistics can seem daunting, understanding a few key concepts is what separates guessing from knowing in clinical practice. This section serves as a practical translator, turning complex stats into simple, powerful clinical insights.
The goal is to take a single measurement from your patient—whether it is range of motion, strength, or functional capacity—and see how it compares to a relevant group. This comparison gives a raw number its context, transforming it into a clear picture of where your patient stands.
Building the datasets that make these comparisons possible is a meticulous process. It is not just about collecting numbers; it is about doing so correctly.
As shown, rigorous sampling, standardized testing protocols, and careful analysis are non-negotiable building blocks. If corners are cut on any of these, the resulting benchmark becomes unreliable.
Understanding the Average Score
The first value you will almost always encounter is the mean. This is simply the technical term for the average score of the entire sample group. For instance, if you tested the grip strength of 100 healthy male office workers aged 30-40, the mean would be the sum of all their scores divided by 100. It provides a central point, or the "typical" score.
However, the mean does not tell the whole story. Imagine two groups of athletes with the exact same average vertical jump. In one group, everyone jumps to a similar height. In the other, some are exceptional leapers while others can barely get off the ground. The average is the same, but the performance profile is completely different.
Measuring the Spread of Data
This is where the standard deviation (SD) is essential. The SD is a single number that indicates how spread out the scores are from the mean. A small SD means that most individuals scored very close to the average—the data is consistent and tightly clustered.
Conversely, a large SD indicates that the scores were widely dispersed. In the clinic, the mean and SD work together to help define the "expected" or "normal" range. As a rule of thumb, scores that fall within one or two standard deviations of the mean are generally considered typical for that population.
For instance, a study on the Sit-to-Stand test might report a mean of 15 repetitions with an SD of 3. This immediately tells a clinician that most healthy individuals in that group can likely perform between 12 and 18 reps (15 ± 3).
Where Does Your Patient Rank?
While the mean and SD are essential, they are not always the most intuitive way to discuss progress with a patient. This is where percentiles are useful. A percentile rank simply indicates the percentage of the normative sample that scored lower than your patient.
If you measure a swimmer's shoulder external rotation and find they are at the 75th percentile, that is an easily understood metric. It means their mobility is greater than 75% of their peers in the reference group. Feedback like "you're in the top quarter" is often more powerful and motivating than saying, "your score was 1.5 standard deviations above the mean."
This is especially helpful for functional tests. You can explore this concept further in our guide on Sit-to-Stand test norms.
Another common term is the z-score. It is another way of showing how far an individual's score is from the mean, measured in units of standard deviations. A z-score of 0 is perfectly average. A +1.0 is one SD above average, and a -2.0 is two SDs below average.
The table below breaks down how you can apply these different statistical measures in your daily practice.
Interpreting Statistical Measures in Clinical Practice
| Statistical Measure | What It Tells You | Example Clinical Application (e.g., Shoulder ROM) |
|---|---|---|
| Mean | The average or "typical" score of the reference group. | The average shoulder external rotation for a healthy pitcher is 110°. |
| Standard Deviation | How much the scores vary around the average. | The SD is 5°, meaning most pitchers fall between 105° and 115°. |
| Percentile Rank | Where an individual stands relative to the group. | Your patient is at the 80th percentile, meaning they have more ROM than 80% of their peers. |
| Z-Score | How many standard deviations a score is from the mean. | Your patient's Z-score is -1.5, indicating their ROM is 1.5 SDs below average. |
| Confidence Interval | The likely range of the true population average. | The 95% CI is 109°-111°, suggesting the data is highly precise. |
These metrics work together to paint a complete picture, helping you move from a simple measurement to a truly informed clinical judgment.
Confidence in Your Interpretation
A final piece of the puzzle is the confidence interval (CI). Research papers often report a 95% confidence interval. This provides a range of values where we can be 95% confident the true population average lies. Think of it as a measure of the data's precision.
A narrow CI is a positive sign; it means the sample mean is a very solid estimate of the real population mean. A wide CI, however, signals more uncertainty, which could be due to a small sample size or high variability in the data.
By becoming comfortable with these core concepts—mean, standard deviation, percentiles, and confidence intervals—you will be able to confidently interpret normative data, read research papers, and turn numbers into clinical strategies that help your patients get better, faster.
Putting Normative Data to Work in Your Clinic
Understanding the statistics is one thing, but the real value emerges when you apply normative data in the clinic. This is where abstract numbers become concrete actions that can genuinely improve patient outcomes, set realistic expectations, and validate your treatment plan.
Let’s walk through a few real-world scenarios that clinicians face every day. From elite athletes to elderly patients, normative data provides the objective context needed to make confident, evidence-based decisions.
Case Study: Making Return-to-Sport Decisions
Consider a 20-year-old university soccer player, nine months post-ACL reconstruction. She reports feeling great and her surgeon has cleared her based on time. But is she truly ready for the demands of competitive soccer?
Time alone is a notoriously poor indicator of readiness (1). This is where objective testing against normative data becomes a game-changer. Using a dynamometer, you can obtain an objective measure of her quadriceps and hamstring strength.
Instead of just comparing her injured leg to the uninjured one (which might also be deconditioned), you can compare her strength values to a database of healthy, age-matched female soccer players. For example, if normative data indicates that elite players in her position have a quadriceps peak force of 250 Newtons, but she is only producing 180 Newtons, you have an objective, data-driven reason to delay her return to full competition.
This approach provides a clear, defensible reason for your decision. More importantly, it gives the athlete a specific, measurable goal to work toward, turning a frustrating delay into a focused and productive phase of her rehabilitation.
Case Study: Quantifying Fall Risk in an Elderly Patient
Let's shift to another common scenario. You are assessing an 82-year-old man who lives alone and whose family is concerned about his fall risk. Subjectively, he seems a bit unsteady, but how do you quantify that risk meaningfully?
The Timed Up and Go (TUG) test is a simple yet powerful tool. You time the patient as they rise from a chair, walk three meters, turn, walk back, and sit down.
But what does a time of 14.5 seconds actually mean? This is where normative data is crucial.
- By consulting age-matched norms for the TUG test, you find that a time greater than 13.5 seconds is associated with a significantly higher risk of falling for community-dwelling adults in his age bracket (2).
- Your patient’s score clearly places him in a high-risk category.
This objective finding allows you to confidently recommend specific interventions, such as a balance and strength program, and clearly communicate the level of risk to his family. You have just turned a vague concern into a quantifiable problem with a clear action plan.
Integrating Modern Tools for Instant Feedback
Today, collecting and comparing data is easier and more precise than ever. Modern tools like digital dynamometers and goniometers are designed to provide instant, powerful feedback that can be seamlessly compared to established norms.
For instance, when measuring grip strength, a digital dynamometer captures the exact peak force. Learning how to use a dynamometer properly is a key clinical skill, as it provides objective numbers you can immediately check against population norms for the patient's age and gender. This comparison instantly flags any functional deficits.
This immediate feedback loop achieves two important things:
- It Validates Your Approach: Objective data confirms your interventions are working, providing measurable proof of progress that is invaluable for your own confidence and for documentation.
- It Motivates the Patient: Seeing their numbers improve and approach the normal range is a significant motivator. It shifts the focus of rehabilitation from subjective feelings to achieving tangible, evidence-based goals.
By putting normative data to work, you elevate your practice from one based solely on experience and intuition to one grounded in objective, scientific evidence.
References
- Grindem H, Snyder-Mackler L, Moksnes H, Engebretsen L, Risberg MA. Simple decision rules can reduce reinjury risk by 84% after ACL reconstruction: the Delaware-Oslo ACL cohort study. Br J Sports Med. 2016;50(13):804-808.
- Podsiadlo D, Richardson S. The timed "Up & Go": a test of basic functional mobility for frail elderly persons. J Am Geriatr Soc. 1991;39(2):142-148.
How to Find and Evaluate Reputable Data Sources
With so much information available, knowing where to find trustworthy data is a core clinical skill. Not all data is created equal, and using a flawed or irrelevant benchmark can be counterproductive. This section serves as your field guide for locating and vetting high-quality normative data to ensure your practice is truly evidence-based.
The gold standard for any clinical data comes from peer-reviewed scientific articles. These are studies that have been scrutinized by other experts in the field before publication, adding a crucial layer of validation. Mastering how to find these sources will help you avoid misleading information and elevate your clinical reasoning.
Navigating Academic Databases
Your primary tools for this search are academic databases, which are specialized search engines for scientific literature. For clinicians in physiotherapy and sports performance, a few platforms are essential:
- PubMed: A vast, free resource from the National Library of Medicine that is the go-to for biomedical and life sciences literature.
- Google Scholar: Casts a wider net, including articles, theses, books, and reports from academic publishers and professional societies.
- SPORTDiscus: A specialized database focused on sports and sports medicine literature, often accessible through university or institutional subscriptions.
When searching, be specific with your keywords. Instead of a vague search like "knee strength," try something more precise, such as "normative data knee extension torque female athletes." This simple technique helps filter out irrelevant results and delivers studies that are much more applicable to your patient’s specific situation.
Normative data is the bedrock of clinical diagnostics. It gives us the comparative baseline we need to interpret an individual's test results. Our reliance on this data to spot deviations from the 'norm' has only grown with advances in standardized testing, making it absolutely essential in modern evidence-based practice. You can explore the foundational concepts of normative data on wisdomlib.org.
Mastering this search process is the first critical step toward finding data you can confidently apply in your clinic.
Your Quick Evaluation Checklist
Once you have found a promising study, the real work begins: critical evaluation. Just because an article is peer-reviewed does not mean it is a perfect fit for your specific patient. You need to become a discerning consumer of research.
Before applying any data, ask yourself a few simple but crucial questions.
-
Does the Study Population Match My Patient? This is non-negotiable. Examine the study's methods section for details on the sample population. Look for age, gender, activity level, sport, and health status. Applying data from elite male powerlifters to a sedentary female office worker is a critical error.
-
Are the Measurement Methods Clear and Replicable? A well-conducted study will describe its testing protocol in painstaking detail. It should specify the exact equipment used, how the patient was positioned, and the instructions they were given. If you cannot replicate their method in your clinic, that data is not useful to you.
-
Is the Source Reputable? Consider the journal where the article was published. Is it a well-known, respected publication in sports medicine, physiotherapy, or conditioning? High-impact journals tend to have a more rigorous peer-review process, which adds a layer of confidence to the findings.
Mastering these skills—searching effectively and evaluating critically—is what empowers you to move beyond simply reading research to intelligently applying it. This is the foundation of a practice that is both art and science, grounded in the best available evidence.
Common Mistakes to Avoid and Best Practices to Follow
Using normative data effectively is a skill that sharpens clinical judgment over time. However, even seasoned professionals can fall into common traps that undermine the data's value.
Knowing these pitfalls is the first step. Let's review them so you can build a more robust, evidence-based practice that truly serves your patients.
One of the most frequent errors is a demographic mismatch. This occurs when a clinician applies data from one population to a completely different individual. For example, using strength norms from elite male rugby players to set goals for a recreational female soccer player is not just a minor error; it is clinically inappropriate. It could set the patient up for failure or, worse, potential injury.
Another common mistake is treating a single data point as the entire story. A low score on a balance test does not exist in a vacuum. It is one piece of a much larger clinical picture and must be interpreted alongside the patient's history, personal goals, and other assessment findings.
Adopting Best Practices for Normative Data
So, how do we avoid these errors and use normative data responsibly? It comes down to integrating a few key practices into your daily workflow. These are not just rules; they are habits that ensure data empowers your clinical reasoning instead of replacing it.
-
Always Match Demographics: Before using a normative dataset, critically examine the study's sample population. You need a close match between the research subjects and your patient in terms of age, gender, activity level, and health status. If it is not a good match, the data is not relevant.
-
Use Data as One Piece of the Puzzle: Normative data should complement, not dictate, your clinical reasoning. It adds a crucial layer of objective context to your assessment, but you must weigh it with your hands-on evaluation, the patient's functional goals, and their feedback.
Remember, the goal is not just to help patients "meet the numbers." The real objective is to restore their function and improve their quality of life. The data is simply a tool that helps guide both you and the patient toward that outcome.
Staying Current and Communicating Clearly
The fields of physiotherapy and sports performance are constantly evolving, with new research emerging regularly. Staying current is a professional obligation.
-
Stay Current with Emerging Research: Make it a habit to read peer-reviewed journals and follow reputable sources in our field. Newer studies may offer more relevant or specific normative data for your patient populations, which will refine your ability to set accurate, meaningful benchmarks.
-
Communicate Findings Effectively: How you discuss the data with a patient is as important as the data itself. Do not just present a score. Frame it in a way that empowers them. Explain what the numbers mean for their recovery, what the target range looks like, and how your treatment plan is designed to help them get there. This transparency builds trust and boosts patient adherence.
By avoiding these common mistakes and adhering to these best practices, you can use normative data as it was intended—as a powerful tool to guide effective, personalized, and truly evidence-based care.
Your Questions About Normative Data, Answered
Let's address some of the most common questions clinicians ask when they begin to explore normative data and its application in the real world.
What's the Difference Between Normative and Criterion-Referenced Data?
Think of it this way: normative data is about comparing an individual to a group, while criterion-referenced data compares them to a fixed standard.
For example, normative data can tell you if a young pitcher’s shoulder external rotation strength is in the 80th percentile for their age and sport. In contrast, criterion-referenced data tells you if their strength meets a minimum threshold known to reduce injury risk, regardless of how their peers perform. Both have their place, but they answer different clinical questions.
Can I Use Data from a Different Population If It's All I Can Find?
This is one of the biggest pitfalls and a temptation to resist. Applying norms from a population that does not closely match your patient—whether in age, gender, or activity level—can lead to incorrect conclusions and inappropriate goals.
It is always better to acknowledge the lack of a perfect benchmark than to use a misleading one. A poor comparison is often worse than no comparison at all.
How Can I Explain Normative Data to My Patients?
Keep it simple and relatable. Percentiles are your best friend here.
Saying, "Your grip strength is at the 70th percentile, meaning it's stronger than 70% of people your age and gender," is instantly understandable. It is much more effective than trying to explain standard deviations. Visuals, like a simple chart showing their score plotted against the normal range, are also incredibly powerful for engaging and motivating patients.
How Often Is Normative Data Updated?
Ideally, normative datasets are refreshed periodically to reflect shifts in population health and performance. Research is a continually advancing field.
As a clinician, it is good practice to stay current with the literature in your specific area. This ensures the benchmarks you rely on are still relevant and have not become outdated.
At Meloq, we believe that objective data is the bedrock of excellent rehabilitation. Our tools, like the EasyForce dynamometer and EasyAngle goniometer, are designed to give you the precise, repeatable measurements you need to confidently compare against normative data. This is how you turn sharp clinical insights into powerful, actionable recovery plans.
Empower your practice with the right tools by visiting https://www.meloqdevices.com.

Featured Product
EasyForce Digital Dynamometer
Handheld muscle strength testing with 99% accuracy. Used in 40+ peer-reviewed studies.
Learn More