
How Is Muscle Strength Measured in Clinical Practice? A Guide for Professionals
Team Meloq
Author
You can't manage what you can't measure. This old saying is especially true in rehabilitation and performance conditioning.
When we need to know how strong a patient or athlete is, we need real, objective numbers—not just a gut feeling. That's where methods like dynamometry and functional testing come in. They give us the hard data we need to build smarter rehabilitation programs, diagnose issues with confidence, and make the right call on returning someone to their sport.
Why Accurate Muscle Strength Measurement Is Non-Negotiable
Trying to eyeball a patient’s strength by watching them move is a bit like checking for a fever by just placing a hand on their forehead. Sure, you might get a rough idea, but you’re missing the precision needed for truly effective treatment. This is why leading clinicians have moved on from subjective guesswork to objective measurement.
By moving our practice from an art of approximation to a science of precision, objective muscle strength measurement allows us to deliver better, more predictable outcomes. It’s about using numbers to tell a clear story of recovery and building unshakeable confidence in every clinical decision we make.
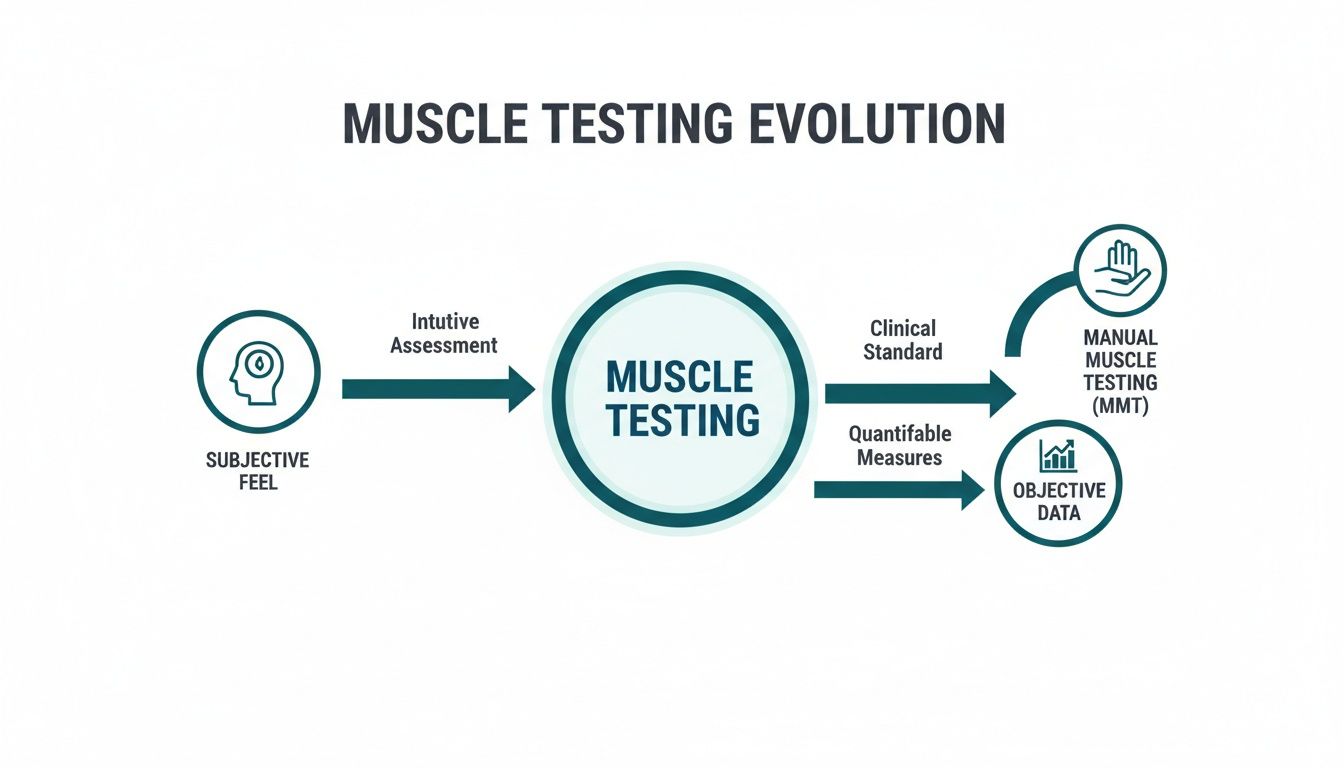
The Journey From Subjective Feel to Objective Data
For decades, the story of how we measure muscle strength was rooted more in the art of clinical touch than in the science of hard numbers. Clinicians relied on methods like Manual Muscle Testing (MMT), a hands-on approach where a therapist applies resistance and grades a muscle's output based purely on their subjective feel.
This system, often using the familiar Medical Research Council (MRC) Scale, was a huge step forward in its time. It gave us a quick, no-cost way to categorise strength on a simple scale, from zero (no contraction) to five (normal strength). At its core, it provided a common language for clinicians to talk about muscle function.
The Limits of Subjective Grading
But as any clinician who has used it knows, this traditional approach has its limits. The difference between a grade of "4/5" (movement against moderate resistance) and "5/5" (movement against maximal resistance) can be a massive grey area, and it's highly dependent on the clinician's own strength and perception (1).
For an athlete, that grey area could mean the difference between being game-ready and risking a devastating re-injury. You can see how this created a pressing need for tools that could offer more detail and, most importantly, objectivity. The goal was never to replace clinical skill, but to arm it with data that tells a much more complete story. This shift from qualitative feel to quantitative fact has deep roots in sports science.
The history of muscle strength testing is surprisingly long and well-documented. Research into strength training dates back to the late 19th century, with hundreds of studies published in the decades that followed (2). Isometric maximal contractions became a dominant testing method in research, while the MRC scale emerged from this rich history to become a clinical standard.
Paving the Way for Modern Measurement
The evolution from subjective scales to objective instruments was really driven by a simple question: How can we get a number that is reliable and sensitive enough to detect small but meaningful changes? This is where the concept of outcome measurement becomes absolutely critical.
Even methods that bridge the gap, like the Rate of Perceived Exertion (RPE), show the value in this transition. While RPE is still subjective, it introduces a standardized scale that helps quantify a person's experience during exercise. It was an important stepping stone toward fully objective measurement because it highlighted the value that numbers could bring to assessment.
Ultimately, the limitations of traditional grading created a clear pathway for the development of modern dynamometry. The need to confidently distinguish between "strong" and "very strong," track progress with precision, and make evidence-based decisions pushed the field toward the objective tools we rely on today. This transition allows us to move beyond approximation and embrace a science of precision—giving us the hard data needed for the highest standard of care.
If we want to get a real picture of muscle strength in a modern clinic, we have to look past the old "push against my hand" methods. The goal today is objective, measurable data. This is the bedrock of evidence-based practice, letting us move from guesswork to genuine precision. These tools make up a versatile toolkit, with each one designed to capture a different piece of the muscle function puzzle.
This shift from subjective feel to objective data represents a huge leap forward in how we assess our clients and athletes.
The key takeaway here is that these modern tools don't replace our clinical judgment. They sharpen it, adding a layer of objective proof that we just couldn't get our hands on before.
Let's dive into a few of the most important tools in our modern toolkit.
Handheld Dynamometry: The Portable Powerhouse
Leading the charge for accessible, objective strength testing is the handheld dynamometer (HHD). Picture it as a super-smart digital scale built specifically to measure the push or pull force a muscle can generate. Its biggest win is portability, allowing a clinician to run an isometric strength test on almost any muscle group, whether in the clinic or out on the field.
The process is straightforward. A clinician holds the device against the client's limb, and the client pushes against it with maximal effort for a few seconds. The HHD records the peak force, usually in Newtons (N) or kilograms-force (kgf). This simple "make test" gives you a hard number, completely removing the subjectivity of traditional manual muscle testing.
Moving from a subjective MMT grade to an objective dynamometer reading has been a game-changer. It’s simply a more sensitive tool, giving us real numbers to compare between limbs and track progress over a rehab program. Interestingly, research suggests that circadian rhythms can influence strength, with some studies showing people test stronger in the late afternoon or evening (3). This just hammers home why having a standardized, consistent testing protocol is non-negotiable for reliable data.
Isokinetic Dynamometry: The Gold Standard
When the research world or a high-performance lab needs the most controlled, detailed look at dynamic muscle performance, they bring out the big guns: isokinetic dynamometry. These larger, stationary machines are widely considered the "gold standard" for muscle assessment (4).
Unlike an HHD that measures static (isometric) force, an isokinetic dynamometer measures strength as a muscle moves through its full range of motion at a fixed, constant speed. That’s its defining feature—no matter how hard the person pushes, the machine's lever arm only moves at the speed you set.
This controlled environment allows for the measurement of peak torque, which is the maximum rotational force a muscle can produce around a joint. Torque is measured in Newton-meters (Nm) and provides a much richer picture of dynamic muscle function than a simple isometric force reading.
Because they're big, expensive, and require more training, you won't find isokinetic dynamometers in every neighborhood clinic. But for sports performance centres and research labs, they're indispensable for a few reasons:
- Detailed Muscle Profiling: They can pinpoint strength deficits at specific angles in the range of motion.
- Velocity-Specific Training: You can test and train at speeds that actually mimic athletic movements.
- Concentric & Eccentric Measurement: They can measure both shortening (concentric) and lengthening (eccentric) contractions.
This level of detail is critical for making those high-stakes return-to-sport decisions after a major injury like an ACL tear. To get a better feel for the different types of devices out there, you can explore this overview of force measurement equipment.
Force Plates: Analyzing The Ground Up
While dynamometers are zeroed in on a specific muscle or joint, force plates measure how the entire body interacts with the ground. These advanced platforms are packed with sensors that measure the ground reaction forces produced during movements like jumping, landing, or squatting.
A force plate isn't measuring a single muscle's strength directly. Instead, it’s giving you data on an athlete's ability to generate explosive power, control their landings, and maintain balance. Key metrics we can pull from force plate data include:
- Peak Vertical Force: The max force an athlete drives into the ground during a jump.
- Rate of Force Development (RFD): How fast someone can produce that force.
- Landing Asymmetry: Differences in how force is absorbed between the left and right legs.
This information is pure gold for assessing neuromuscular control and injury risk. For example, if an athlete has a major landing asymmetry after an ankle sprain—even if their isolated muscle strength has returned to "normal"—it's a potential red flag. It may suggest that they're still compensating and could be at a higher risk for another injury.
Comparison Of Key Muscle Strength Measurement Tools
To bring it all together, here's a quick look at how these primary tools stack up against one another in a clinical setting. Each has its place, and understanding their strengths and weaknesses helps us choose the right tool for the right job.
| Measurement Tool | What It Measures | Primary Use Case | Pros | Cons |
|---|---|---|---|---|
| Handheld Dynamometer (HHD) | Isometric Force (N, kgf) | Quick, objective strength testing in clinical settings; limb symmetry assessment. | Portable, affordable, easy to use, versatile for many muscle groups. | Measures static strength only; can be dependent on tester's strength and stability. |
| Isokinetic Dynamometer | Dynamic Torque (Nm) | Detailed muscle performance analysis in research & high-performance sport; return-to-sport testing. | Gold standard accuracy; measures strength at various speeds and contraction types. | Expensive, large, not portable, requires significant training. |
| Force Plate | Ground Reaction Force (N) | Assessing explosive power, landing mechanics, and balance; injury risk screening. | Provides functional, whole-body data; excellent for dynamic movement analysis. | Measures global output, not isolated muscle strength; can be expensive and complex to interpret. |
Ultimately, these tools—handheld dynamometers, isokinetic systems, and force plates—give us a layered understanding of strength. We can go from a focused, isometric test of one muscle group to the dynamic torque produced across a joint, and all the way to the global power expressed during a functional jump. This modern toolkit is what allows us to be truly comprehensive in how we assess and manage our clients' strength.
How to Standardize Testing for Rock-Solid Data
Owning a powerful tool like a handheld dynamometer is just the beginning. The real challenge—and where the magic really happens—is ensuring the numbers you get are not just accurate, but also consistent and repeatable.
Without a standardized protocol, you're just collecting noisy data. That makes it impossible to know if a change in strength is real progress or just a fluke in your testing method.
Think of it like a science experiment. If you change a bunch of variables at once, you can't be sure what actually caused the result. In muscle testing, those variables are everything from the client's position to the very words you use. Standardizing your approach is how you lock down those variables to get trustworthy data, every single time.
The Pillars of a Standardized Protocol
To build a testing procedure that gives you clean, actionable data, every little detail matters. Small inconsistencies can easily add up to big errors, completely undermining the value of your measurements. A truly robust protocol is built on a few key pillars.
These aren't just suggestions; they're requirements for collecting professional-grade data.
-
Consistent Patient Positioning: The client has to be in the exact same position for every single test and re-test. A hip abduction test done lying on their side will produce a wildly different number than one done while standing. Document the exact position, down to the joint angles, so you can replicate it perfectly weeks or months later.
-
Precise Device Placement: The dynamometer needs to be placed on the exact same spot on the limb for every measurement. Even shifting it by a few centimeters can change the leverage and mess with the force reading. Using anatomical landmarks as your guide is non-negotiable.
-
Unyielding Stabilization: The client's body and the joint you're testing have to be rock-solid. Any unwanted wiggling or movement means force is either being lost or generated by other muscle groups, polluting your data. Use straps, belts, or even your own body to lock everything down and prevent compensation.
The Human Elements of Testing
Beyond the physical setup, how you interact with your client can dramatically influence their effort and, by extension, the final number on the screen. These "soft skills" are a critical part of a hard-data protocol.
Verbal cueing, for instance, is incredibly powerful. Using the same script for every test ensures the client receives identical instructions and encouragement. Phrases like "Push as hard as you can... Go, go, go... and relax" should be delivered with the same timing and tone every time. A half-hearted cue will almost always get you a half-hearted effort.
When measuring strength, your goal is to capture a true maximal voluntary contraction. Inconsistent instructions, varying encouragement, or a distracting room can stop a client from giving their all, leading to data that underestimates what they're truly capable of.
The number of reps you perform also plays a huge role. A single test might not capture a person's best effort. Many research-backed protocols recommend performing 2-3 repetitions for each test, with a brief rest of 30-60 seconds in between to ensure reliability and capture peak output (5). This lets you capture their best effort while accounting for any learning curve or initial hesitation.
For a deeper dive into how these objective numbers stack up against older methods, check out our guide on the grading muscle strength scale.
Why Reliability Is Your North Star
In the world of clinical measurement, a tool is only as good as its reliability. This concept, known as clinimetrics, is what gives you unshakable confidence in your data. There are two main types of reliability you need to master:
-
Intra-rater reliability: This answers the question, "Are my measurements consistent?" If you test the same person three times in a row, do you get pretty much the same result? High intra-rater reliability means your personal testing process is dialed in and dependable.
-
Inter-rater reliability: This asks, "Are our measurements consistent between different clinicians?" If you measure a client's quad strength and your colleague does it an hour later, do you both get the same number? This is crucial for any clinic where multiple therapists might see the same client.
By creating and sticking to a strict, standardized protocol, you ensure that both your own measurements and those of your entire team are reliable. That consistency is what transforms your dynamometer from a neat gadget into a powerful clinical instrument you can use to guide decisions with total confidence.
Turning Raw Numbers into Actionable Clinical Insights
Collecting objective strength data is a monumental step forward, but the numbers themselves don't tell the whole story. A peak force reading of 250 Newtons, for instance, is just a data point. Its true power is unlocked only when you place it in a meaningful context. This is where the art and science of interpretation begin, turning simple measurements into a powerful narrative of a patient's journey.

The first step in building this narrative is making a relevant comparison. Is 250 N of quadriceps strength good or bad? Well, that depends. For a 100 kg athlete, it might be alarmingly low. For a 50 kg adolescent, it could be excellent. By transforming raw data into comparative metrics, you can start making truly informed clinical decisions.
Normalizing Data for Meaningful Comparisons
To create this essential context, clinicians rely on normalization—the process of adjusting a raw score to account for individual differences. It’s what makes comparisons fair, goals realistic, and our understanding of function truly clear.
Two of the most valuable normalization methods we use are:
-
Normalizing to Body Weight (%BW): This is a simple yet powerful technique. You just divide the force or torque value by the person's body weight. This tells you how well they can manage their own mass, which is directly related to daily activities like climbing stairs or standing up from a chair. Research suggests that certain strength-to-bodyweight ratios may be valuable benchmarks for assessing function and injury risk (6).
-
Limb Symmetry Index (LSI): For anyone recovering from a unilateral injury (think an ACL tear in one knee), the LSI is a common and valuable metric. It’s calculated by dividing the score of the injured limb by the score of the uninjured limb and multiplying by 100. This gives you a clear percentage that immediately highlights any deficit.
For example, if the injured quad produces 200 N and the uninjured quad produces 250 N, the LSI would be 80% (200/250 * 100). This immediately signals a 20% strength deficit that needs to be addressed before a safe return to sport.
Visualizing Progress to Drive Engagement
Once you have these meaningful metrics, the next step is bringing them to life. A simple chart tracking LSI or %BW over time is one of the most powerful tools in your clinical arsenal. It transforms abstract numbers into a clear, visual story of progress.
This visual feedback is incredibly motivating for patients. It shows them that their hard work is paying off, even when the gains feel small day-to-day. It also serves as a powerful communication tool for stakeholders like coaches, parents, or insurance providers, objectively demonstrating the effectiveness of your treatment plan.
By turning raw numbers into actionable clinical insights, you elevate your practice. You move from simply collecting data to using it to create personalized goals, drive patient motivation, and make confident, evidence-based decisions. This process often involves tailoring exercise programs, like those seen in guides for strength training for weight loss, where objective progress tracking is absolutely key to success.
Connecting Isolated Strength to Real-World Function
Objective strength data from a dynamometer is powerful, but it only tells part of the story. A strong quad is great, but can your patient actually run, jump, and change direction with confidence? The real goal is always to connect that isolated number on a screen to their ability to perform meaningful, real-world tasks.
This is where functional assessments come into play. By pairing hard dynamometry data with performance-based tests, we get a much richer, more complete picture of a person's true capabilities and readiness for the demands of life or sport.
Beyond the Numbers: A Holistic Assessment
Taking an integrated approach helps uncover critical gaps that isolated testing alone might miss. For example, a patient’s quad strength might measure at 95% of their uninjured side—which looks fantastic on paper. But then you ask them to do a single-leg hop for distance, and they only hit 80% of the other side.
This gap between isolated strength and functional power is a crucial clinical insight. It tells us that while the muscle can produce force, the patient may lack the confidence, neuromuscular control, or rate of force development to actually use that strength dynamically.
These discrepancies aren't failures in our testing; they are opportunities. They point us exactly where we need to go, helping refine late-stage rehabilitation programs to focus less on pure strength and more on power, coordination, and sport-specific motor patterns.
Simple Tests, Powerful Insights
Functional testing doesn't need to be complicated or require a million-dollar lab. Simple, validated tests can give you excellent data on functional lower extremity strength.
Consider the five-times-sit-to-stand test, a well-established functional measure. It's as simple as it sounds: measure the time it takes to stand up from a standard chair five times. This quick, reproducible method has been shown to have a strong correlation with lower limb strength and has high reliability, proving just how effective simple tests can be (7). If you're looking for other ways to build foundational strength, you can find great info on strength training for weight loss and its benefits.
Ultimately, by combining the precision of dynamometry with the real-world context of functional tests—whether it’s jump series, agility drills, or a simple chair stand—we build a complete assessment. This data-driven approach allows us to make more informed, confident decisions about a patient’s true functional capacity and their readiness to return to the activities they love.
Your Top Muscle Strength Testing Questions, Answered
Jumping into objective data always brings up a few practical questions. Let's tackle some of the most common ones we hear from clinicians, breaking down the key concepts so you can feel confident putting them into practice.
How Often Should I Test Strength During Rehab?
There's no single right answer here—it really depends on where your patient is in their recovery journey.
Early on, especially in acute, post-operative phases, testing might occur weekly to provide crucial, real-time feedback for guiding loading strategies and avoiding overload.
For athletes in the later stages of rehabilitation, re-testing every two to four weeks is often sufficient to track progress toward return-to-play goals. The most important thing? Consistency. A regular testing schedule is what builds a reliable data trend, giving you the solid evidence you need to validate your program changes.
Can Handheld Dynamometers Actually Test the Lower Body?
Absolutely. Handheld dynamometers (HHDs) are incredibly versatile and work well for most major muscle groups, from the rotator cuff right down to the hamstrings. The biggest hurdle comes when you're up against powerful lower-body muscles, like the quads or glutes. The challenge isn't the device; it's generating enough counter-force yourself.
To make sure you're measuring your patient's true maximal effort—and not just hitting your own strength limit—external stabilization is essential. Using non-elastic straps or a fixed mounting system is considered the best practice to ensure the data truly reflects your patient's output, not the tester's (8).
What’s the Real Difference Between Force and Torque?
This is one of the most fundamental concepts to grasp, and it's simpler than it sounds.
Force is a straight-line push or pull. It’s what an HHD measures directly, giving you a reading in Newtons (N) or kilograms-force (kgf). Torque, on the other hand, is rotational force—the twisting effect that causes movement around a joint, measured in Newton-meters (Nm).
Think of it like using a wrench. The push you apply to the handle is the force. The turning effect on the bolt is the torque.
You can easily calculate torque from an HHD reading by multiplying the force it measures by the distance from the device to the joint's center (that's the "lever arm"). So, while HHDs measure linear force, isokinetic dynamometers are built to measure torque directly.
References
- Cuthbert R, Ripley N, Suchomel T, Alewijnse J, Haff G, Comfort P. The Convergent Validity of the Test-Retest Reliability of the MMT and HHD to Assess Hip Strength. Isokinetics and Exercise Science. 2021;29(2):169-176.
- Todd J, Shurley J, Todd T. Thomas L. DeLorme and the science of progressive resistance exercise. Journal of Strength and Conditioning Research. 2012;26(11):2913-2923.
- Teo W, Newton MJ, McGuigan MR. Circadian rhythms in muscular strength and power: a review. Sports Medicine. 2011;41(8):647-663.
- Drouin J, Valovich-mcLeod T, Shultz S, Gansneder B, Perrin D. Reliability and validity of the Biodex system 3 pro isokinetic dynamometer velocity, torque and position measurements. European Journal of Applied Physiology. 2004;91(1):22-29.
- Stark T, Walker B, Phillips JK, Fejer R, Beck R. Hand-held dynamometry correlation with the gold standard isokinetic dynamometry: a systematic review. PM R. 2011;3(5):472-479.
- Heishman A, Daub B, Miller R, Brown B, Freitas E, Bemben M. The effects of body mass on the force- and power-time curves in the isometric midthigh pull. The Journal of Strength & Conditioning Research. 2020;34(5):1265-1271.
- Goldberg A, Chavis D, Watkins J, Wilson T. The five-times-sit-to-stand test: validity, reliability and detectable change in older females. Aging Clinical and Experimental Research. 2012;24(4):339-344.
- Mentiplay BF, Perraton LG, Bower KJ, Adair B, Pua YH, Williams GP, et al. Assessment of lower limb muscle strength and power using hand-held and fixed dynamometry: a reliability and validity study. PloS one. 2015;10(10):e0140822.
At Meloq, we design precise, portable tools like the EasyForce digital dynamometer to help clinicians like you capture the objective data needed for superior outcomes. Discover how our ecosystem can elevate your practice by visiting https://www.meloqdevices.com.

Featured Product
EasyForce Digital Dynamometer
Handheld muscle strength testing with 99% accuracy. Used in 40+ peer-reviewed studies.
Learn More