
How Do You Calculate Average Force A Clinician's Guide
Team Meloq
Author
Sure, peak force grabs the headlines. It’s the big, impressive number. But as experienced clinicians know, average force tells a much deeper story about a patient’s true functional capacity. It reveals their endurance and ability to sustain effort—critical insights for any real-world rehabilitation plan.

Why Average Force Matters More Than You Think
In clinical practice, it's easy to get fixated on the highest number a patient can produce. Peak strength is an important metric, no doubt, but it only captures a single, fleeting moment.
Average force, on the other hand, shows us the quality of that effort over an entire movement or contraction. It provides a far more complete picture of neuromuscular control and sustainability. For us, this shift in focus is a game-changer.
Looking at the average allows us to:
- Quantify Endurance: It reveals how well a patient can maintain force, which is what really matters for functional activities like walking, climbing stairs, or carrying groceries.
- Sharpen Return-to-Play Decisions: Average force gives us a more robust indicator of an athlete's readiness. We can move beyond simple strength to assess their ability to repeatedly produce force, even under fatigue.
- Track Progress Objectively: It offers a reliable, data-driven way to monitor rehab progress. This gives us clear evidence to guide treatment and keep our patients motivated.
Peak Force Vs Average Force At A Glance
To put it simply, peak and average force give us different, but equally valuable, windows into a patient's condition. This quick comparison highlights how each metric offers distinct clinical insights.
| Metric | What It Reveals | Clinical Application | Patient Scenario |
|---|---|---|---|
| Peak Force | The maximum strength produced in a single moment. | Assessing explosive power, maximal voluntary contraction, and initial strength deficits. | An athlete performing a max vertical jump to test explosive leg power. |
| Average Force | The ability to sustain force over a duration. | Evaluating endurance, functional capacity, and neuromuscular control under fatigue. | A post-op knee patient holding an isometric contraction for 10 seconds to assess their ability to stabilize the joint during daily activities. |
Both numbers have their place, but a comprehensive assessment uses both to build a complete clinical picture.
From Subjective Guesswork to Data-Driven Therapy
Integrating average force into our assessments helps us move away from purely subjective measures. It lets us confidently answer critical questions like, "Is this athlete's injured limb really capable of sustaining the forces required for their sport?" or "Has this patient regained the functional strength needed to live independently?"
The answers are in the data.
This isn't just theory; it's backed by research. While specific statistics can vary, the principle is clear: objective measurement improves outcomes. Studies investigating the use of quantitative strength testing in rehabilitation have consistently demonstrated its value in guiding clinical decisions and reducing the risk of re-injury upon return to sport (1, 2).
Average force isn't just a number; it's a narrative. It tells the story of an individual's ability to not just generate force, but to control and sustain it—a key element in both rehabilitation and performance.
Ultimately, understanding the objective of measurement is what refines our clinical practice. By looking beyond the peak, we gain a more holistic view of a patient's capabilities, empowering us to make more informed, data-driven decisions that lead to better, more durable outcomes.
References
- Hegedus EJ, McDonough SM, Bleakley C, Baxter D, Cook CE. Clinician-friendly lower extremity physical performance tests in athletes: a systematic review of measurement properties and correlation with injury, part 1. The tests for knee function. Br J Sports Med. 2015;49(10):649-56.
- Grindem H, Snyder-Mackler L, Moksnes H, Engebretsen L, Risberg MA. Simple decision rules can reduce reinjury risk by 84% after ACL reconstruction: the Delaware-Oslo ACL cohort study. Br J Sports Med. 2016;50(13):804-8.
The Two Main Ways to Measure Average Force
When you want to figure out average force, there are two primary routes clinicians and researchers take. Each method tells a slightly different story about force production, and the one you choose often comes down to the equipment you have and the specific movement you're analyzing.
The first method is the 'Area Under the Curve' approach, also known as calculating the impulse. This is the gold standard, the method used by advanced equipment like force plates. Imagine plotting a patient's force output during a jump on a graph—it creates a curve that rises and falls. The area under this entire curve represents the total impulse, and by dividing this by the duration of the movement, the device calculates a true average force.
This gives you a complete, continuous picture of the entire effort. It’s not just a snapshot; it's the full feature film of the force produced from start to finish.
The Discrete Sampling Method
The second, and more common, method in many clinical settings is discrete sampling. This is the technique you’ll find in portable tools like handheld dynamometers, which are fantastic for their accessibility and ease of use. Instead of a continuous curve, the device takes multiple force readings—or samples—every second over a set period, like a five-second isometric hold.
It then simply averages these individual data points to give you the average force. Think of it like taking several photos during an event instead of one long video. You get a series of snapshots that, when averaged together, give you a very strong representation of the overall effort. You can find more details on how to select a suitable device to measure force for your specific needs in our related guide.
This discrete approach is incredibly practical for everyday clinical tests, like assessing the isometric strength of a patient's quadriceps or grip.
A Concept with Real-World Impact
The principles behind calculating average force aren't just confined to the clinic; they have profound implications in fields like automotive safety. Engineers use the exact same impulse-momentum relationship to design airbags. By extending the time of impact during a crash, airbags reduce the average force exerted on the occupant, saving lives.
This same precision matters in a clinical context. A core concept in physics is that average force is the change in momentum divided by the time over which that change occurs. In rehabilitation, we apply this by aiming to improve a patient's ability to generate and sustain force over time, effectively improving their functional 'impulse'. Discover more insights about these findings on BYJUS.com.
Whether you're looking at a sophisticated force-time curve or a simple number on a dynamometer, you're tapping into a powerful concept. Understanding these two core methods helps you appreciate what your measurement tools are telling you, allowing you to interpret the data with greater confidence and apply it more effectively in your practice.
From Raw Data to Real Numbers: A Practical Walkthrough
Theory is one thing, but getting your hands on the numbers is where it all starts to click. Let's walk through how to actually calculate average force, starting with a simple manual method before jumping into the automated tools we rely on in modern practice.
Seeing how these calculations are built from the ground up gives you a much deeper appreciation for what your devices are doing behind the scenes. It takes the mystery out of the process and helps you trust the data you're collecting.
This flowchart breaks down the data collection process for two of our most common tools: force plates and handheld dynamometers.
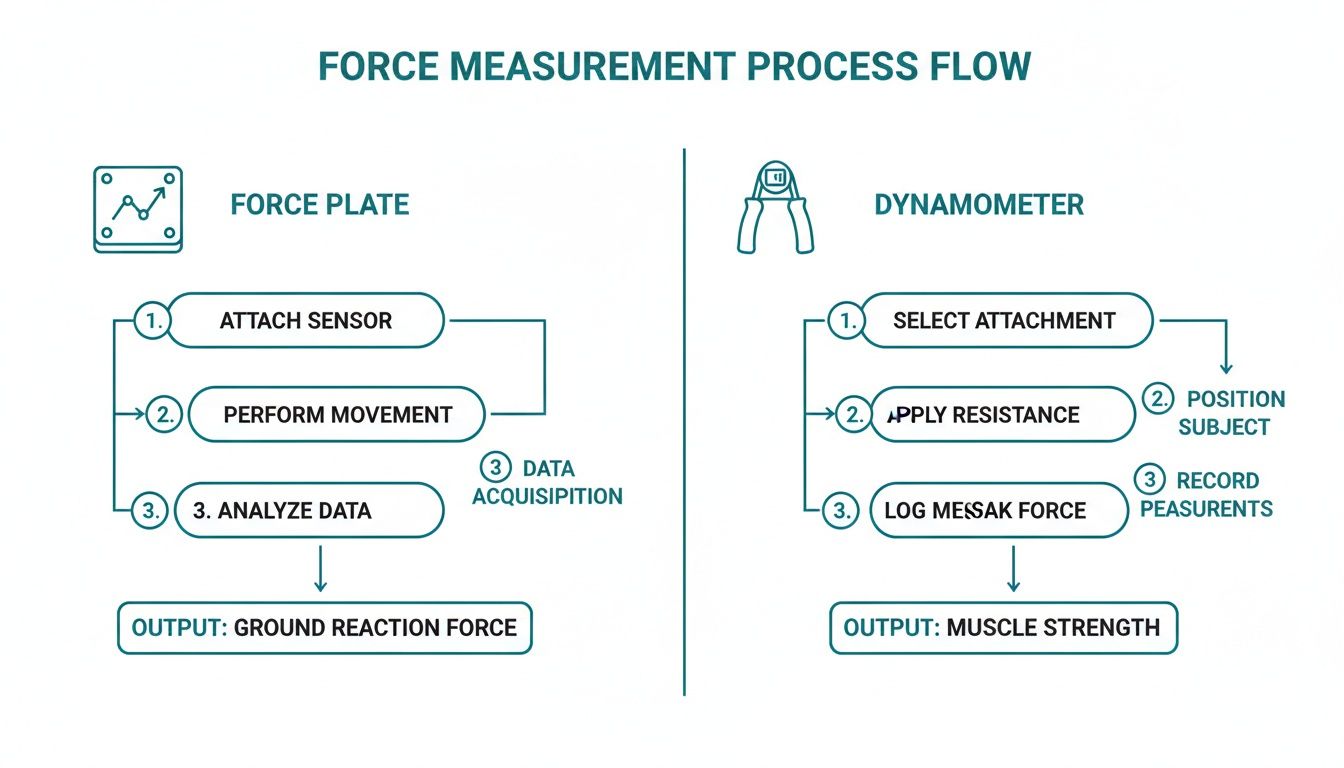
As you can see, both continuous and discrete data streams eventually get processed into the real-world metrics we care about, like ground reaction force and muscle strength.
The Manual Spreadsheet Method
Let's say you just finished a five-second isometric quad test with a patient using a basic digital dynamometer. The device gives you a force reading once per second—a perfect example of discrete sampling.
Your raw data might look something like this:
- Second 1: 120 Newtons (N)
- Second 2: 145 N
- Second 3: 150 N
- Second 4: 148 N
- Second 5: 142 N
To find the average force, you just add up all the force readings and divide by how many you took. Simple.
Calculation: (120 + 145 + 150 + 148 + 142) / 5 = 705 / 5 = 141 N
This old-school approach is great for understanding the core math. But honestly, it’s slow and leaves way too much room for human error, especially if you're dealing with longer tests or higher sampling rates.
The Automated Advantage With Modern Tools
Now, think about how a modern digital dynamometer or force plate handles the same task. These aren't just simple measurement tools; they're packed with processors that do all the heavy lifting for you in an instant.
When you run that same five-second test, the device is internally sampling the force hundreds—or even thousands—of times per second. It then crunches the numbers and spits out the final, precise average on the screen the moment you finish.
This automation is a huge leap forward. It gets rid of manual data entry, slashes the risk of calculation mistakes, and gives you immediate feedback to share with your patient or athlete. You get to focus on their form and effort, not on playing with a calculator.
A Glimpse Into The Code
If you're curious about what's happening under the hood, the logic is surprisingly straightforward. A little bit of code can do the same job on a massive dataset almost instantly. Here’s a basic Python example that does exactly what we just did by hand.
# A simple list representing force readings in Newtons
force_readings = [120, 145, 150, 148, 142]

# Calculate the sum of all readings
total_force = sum(force_readings)

# Count the number of readings
number_of_readings = len(force_readings)

# Calculate the average force
average_force = total_force / number_of_readings

# Print the result
print(f"The average force is: {average_force} N")
This snippet mirrors our manual calculation but can tackle thousands of data points without breaking a sweat. It’s this kind of processing power that lets modern clinical tools deliver such rich, immediate data.
If you want to go deeper into the specific equations at play, we've laid it all out in our guide on force calculations formula. Seeing these methods side-by-side really highlights the journey from foundational principles to the efficient, accurate tools we count on today.
Getting Clean and Reliable Force Data
Calculating average force is only useful if the numbers you're plugging in are solid. Just like a chef needs fresh ingredients for a great meal, clinicians and coaches need clean, reliable data for meaningful insights. Ultimately, the quality of your data comes down to the quality of your technique.

This means paying attention to the little things during data collection. A few simple procedural steps can be the difference between noisy, questionable results and a trustworthy dataset that lets you confidently guide your clinical decisions.
Setting the Stage for Accurate Measurement
Before you even press "start" on a test, there are a few non-negotiable steps that lay the foundation for accuracy. Overlooking these can introduce errors that will absolutely skew your final average force calculation.
- Zero Your Device. Every. Single. Time. Always zero or "tare" your dynamometer or force plate right before each test. This removes any pre-existing load or sensor drift, making sure your measurement starts from a true zero baseline.
- Pick the Right Sampling Rate. The speed at which your device collects data points—its sampling rate—really matters. For slow, controlled movements like an isometric hold, a lower rate is perfectly fine. But for explosive actions like a jump, you need a higher sampling rate to accurately capture the rapid changes in force. While a consensus is still debated, rates of 500 Hz to 1000 Hz are commonly recommended for capturing peak force and rate of force development during dynamic movements (1).
Standardizing your testing protocol is just as important. Think consistent patient positioning, standardized verbal cues ("Build up your force... push as hard as you can... GO!"), and identical test durations. This is how you create repeatable conditions, which is the key to getting reliable test-retest data.
Without standardization, you can't be sure if a change in average force is from a real physiological adaptation or just a variation in how the test was done. Consistency eliminates doubt.
Filtering and Making Sense of Your Data
Even with perfect technique, raw force data can have small fluctuations or "noise." Most modern measurement systems apply a gentle digital filter to smooth this out without distorting the true signal. This process helps ensure the final number is a clean representation of the person's actual output. Curious about the tech that makes this possible? Our guide explains how a dynamometer works to translate physical effort into precise digital data.
This level of precision is vital in athletic settings. While specific figures can be context-dependent, research consistently shows that significant strength asymmetries between limbs are a notable risk factor for lower limb injuries (2). Monitoring average force can be an effective way to track and address these imbalances as part of a comprehensive injury prevention or rehabilitation program.
When you prioritize clean data collection, you ensure your average force calculations are built on a solid foundation. This makes your clinical insights that much more powerful and actionable.
References
- Maffiuletti NA, Aagaard P, Blazevich AJ, Folland J, Tillin N, Duchateau J. Rate of force development: physiological and methodological considerations. Eur J Appl Physiol. 2016;116(6):1091-1116.
- Bishop C, Turner A, Read P. Effects of inter-limb asymmetries on physical and sports performance: a systematic review. J Sports Sci. 2018;36(10):1135-44.
Turning Average Force Data Into Clinical Action
Collecting objective numbers is just the starting line. The real art and science of clinical practice lies in taking that data, making sense of it, and using it to drive decisions. Honestly, understanding how to calculate average force is pretty useless if you don't know how to apply it. The numbers on the screen have to translate into a clear, actionable plan for the person right in front of you.
This jump from data to action is where we see the most significant impact on patient outcomes. It’s all about moving beyond simply jotting down a value. We need to be asking, "What does this number really tell me about this person's functional capacity, and what are we going to do about it?"
Scenarios in Practice
Let’s get practical. Picture a patient with a neuromuscular condition doing a series of grip strength tests. From one week to the next, their peak force might look relatively stable—no big changes there. But a gradual decline in their average grip force over a 10-second hold can be the very first objective sign that fatigue is getting worse. This insight lets you adjust their activity guidelines or energy conservation strategies before they experience a noticeable functional drop-off.
Now, think about an athlete in the late stages of ACL rehab. Their single-leg hop test might show symmetrical peak landing forces, making you think they’re good to go. But a closer look at the average ground reaction force during landing might reveal a subtle deficit. Maybe the athlete is "stabbing" at the ground on their surgical side—generating a high peak force but failing to control and absorb the load through the full landing. This screams neuromuscular control issue, something that absolutely has to be addressed to prevent another injury.
When you're interpreting data, context is king. Average force often tells the underlying story of control and sustainability that peak force completely misses. It highlights not just the raw ability to produce force, but the quality and efficiency of that force production.
Setting Meaningful Goals with Data
A huge part of turning data into action is knowing what a meaningful change actually looks like. Small fluctuations day-to-day are normal, but a consistent trend is what's clinically significant. For instance, a 10-15% increase in average force during a key functional test over several weeks is a solid indicator that your intervention is hitting the mark (1).
Using data this way makes for incredibly specific goals and powerful communication with everyone involved:
- For Patients: Instead of just saying "you're getting stronger," you can pull up a graph and say, "Look, your ability to sustain force in your quad has improved by 15%. That's a big reason why you’re finding it easier to climb stairs." It’s tangible proof.
- For Coaches: You can give them objective data they can sink their teeth into. "Her average force production during a 3-second pull is now symmetrical. This tells us she's ready to progress to more dynamic rotational drills." No more guesswork.
This objective feedback loop builds confidence and buy-in from everyone. If you’re interested in seeing how these data insights are being integrated into the tools we use every day, exploring advanced medical technology solutions can show you what’s possible in modern clinics.
References
- Impellizzeri FM, Marcora SM, Coutts AJ. A new method to quantify training load in soccer players. Int J Sports Physiol Perform. 2005;0(3):281-7.
Got Questions About Average Force?
Even when you've got the basics down, a few practical questions always pop up once you start calculating average force in the clinic or gym. Let's clear up some of the common ones so you can feel confident in how you're using this metric.
One of the first points of confusion is often the difference between average force and the rate of force development (RFD). They’re related, sure, but they tell you very different things about neuromuscular performance.
Here’s an easy way to think about it: average force is all about sustained output and endurance. RFD, on the other hand, is about explosiveness—how fast someone can generate force (1). A track cyclist holding a tough gear needs incredible average force, but a sprinter bursting from the blocks is all about that initial, high RFD.
How Do I Pick the Right Time Interval?
This is a big one. Choosing the right time window for your calculation is probably the most common hurdle, and the honest answer is: it completely depends on the movement you’re analyzing. There's no one-size-fits-all rule. Context is king.
- For explosive movements like a countermovement jump, you want to zero in on the propulsive phase. That’s the window from the moment the upward push begins to the instant the feet leave the ground.
- For isometric contractions, like a mid-thigh pull or a max grip test, a common method is to analyze a stable 3-5 second window right from the middle of the effort. This sidesteps the initial ramp-up and the tail-end drop-off from fatigue, giving you a much cleaner picture of true maximal effort.
Can I Compare Data Between Different Devices?
Finally, the million-dollar question: can you reliably compare data from two different dynamometers, for instance? The short answer is, you have to be very careful.
Little variations in sensor tech, the software running inside the device, and even calibration routines can cause frustrating discrepancies in the absolute force values you see.
The best practice, without a doubt, is to use the exact same device for every single test and follow-up with a client or athlete. This keeps your data consistent and lets you track percentage of change over time—which is often far more meaningful than trying to compare raw Newton values from different tools.
Tackling these practical questions head-on will help you dial in your testing protocols and make sure the data you're collecting is not just accurate, but truly relevant to your goals.
References
- Maffiuletti NA, Aagaard P, Blazevich AJ, Folland J, Tillin N, Duchateau J. Rate of force development: physiological and methodological considerations. Eur J Appl Physiol. 2016;116(6):1091-1116.
Move beyond subjective assessments and embrace data-driven practice with Meloq. Our ecosystem of digital measurement tools—including the EasyForce dynamometer and EasyAngle goniometer—is designed to give you accurate, repeatable, and actionable insights. Standardize your testing, document progress objectively, and make more confident clinical decisions. Discover how Meloq can elevate your practice.

Featured Product
EasyForce Digital Dynamometer
Handheld muscle strength testing with 99% accuracy. Used in 40+ peer-reviewed studies.
Learn More