
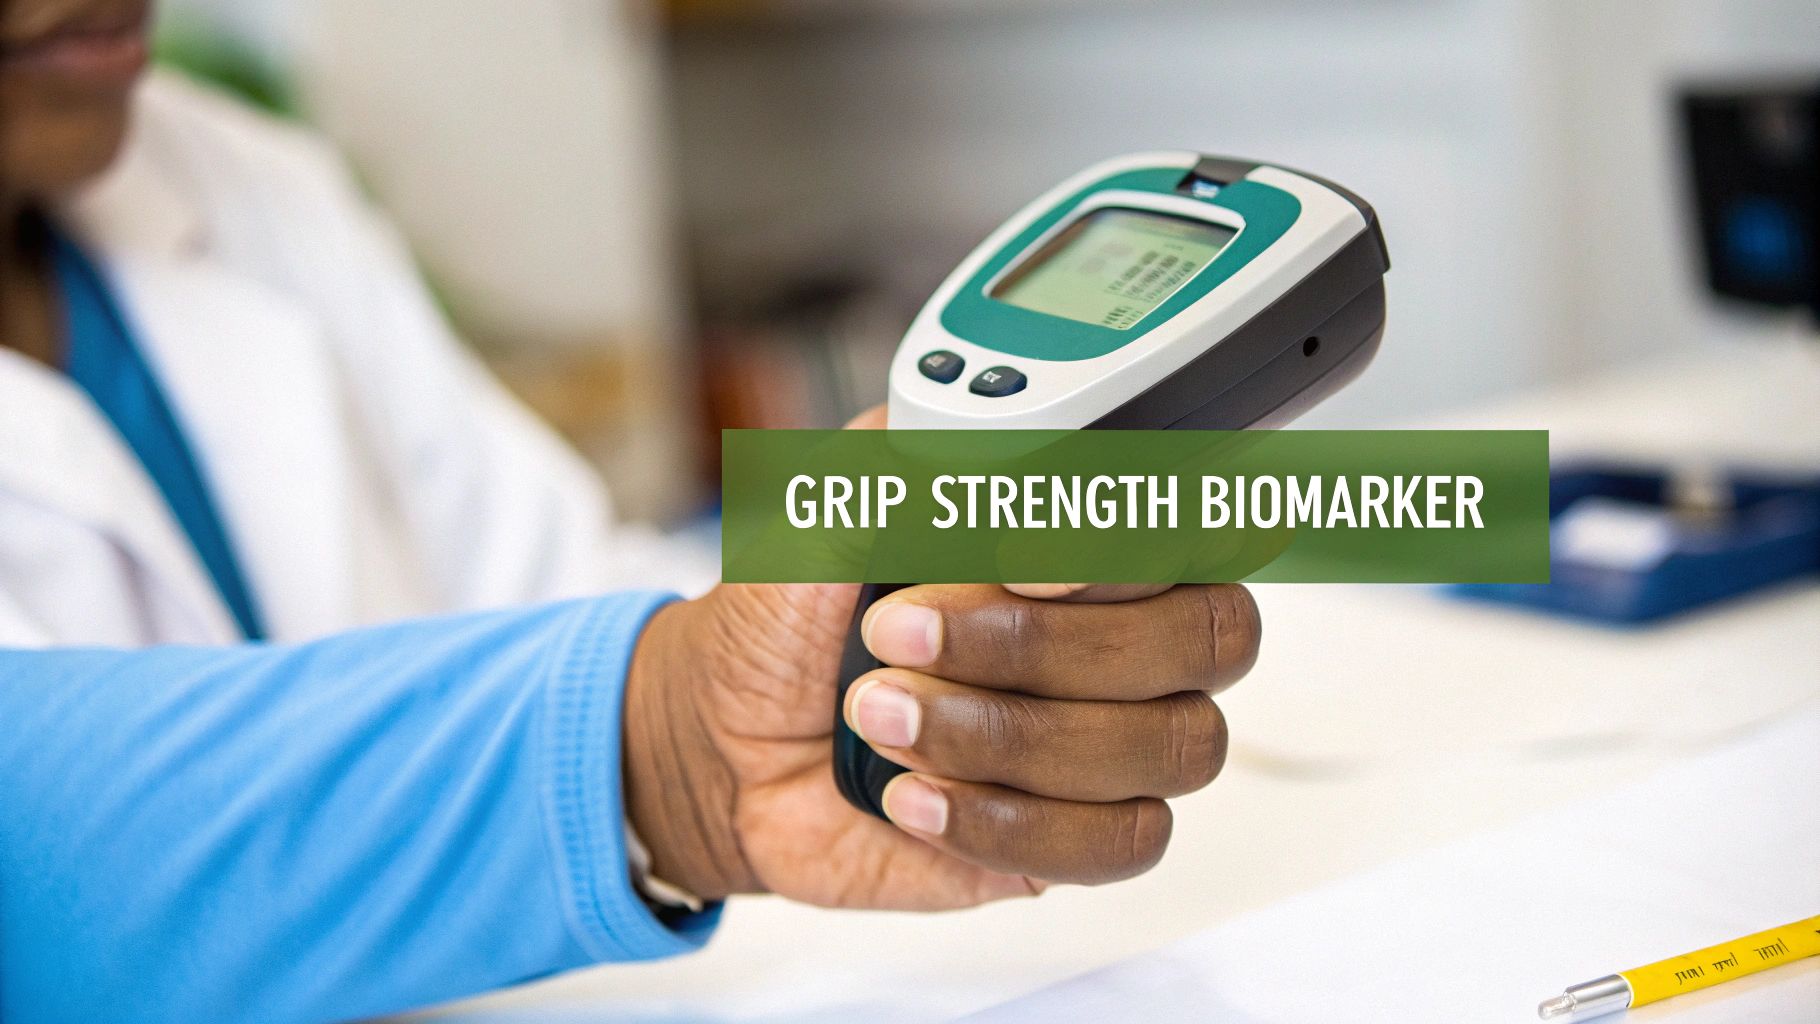
Grip strength can be considered a vital sign for the entire body, much like a blood pressure reading provides a snapshot of cardiovascular health. It is a simple, non-invasive test that measures the maximum force a person can generate with their hand and forearm muscles.
But it represents much more than just hand power. This quick assessment acts as a powerful biomarker, offering insights into an individual's overall muscle strength, nutritional status, and even helping to predict future health outcomes.
Why Grip Strength Is a Vital Health Indicator
This single metric reframes hand strength from a basic measure of force into a critical window into a person’s overall health and resilience (1).
For physical therapists, sports coaches, and physicians, it's a quick and reliable way to obtain objective data that goes far beyond a subjective "how strong do you feel?" assessment.
A Predictor of Overall Muscle Strength
Hand strength is a surprisingly accurate proxy for total body strength. This is because the muscles in the hand and forearm are part of a larger kinetic chain. A firm grip often signals solid muscle mass and good overall physical condition.
Conversely, low grip strength can be an early indicator of sarcopenia—the age-related loss of muscle mass and function—which may point to a state of general vulnerability (2). This makes it an incredibly valuable screening tool, especially in geriatric care.
More Than Just Muscle
The clinical importance of grip strength extends beyond the musculoskeletal system. Research has uncovered compelling links between a person's grip and other critical areas of health.
For instance, a weaker grip has been associated with:
- Increased Frailty: It’s a primary indicator of frailty, helping to identify individuals who might have a limited capacity to cope with illness or injury (2).
- Nutritional Status: Since muscle mass is closely linked to nutrition, a drop in grip strength can signal poor nutritional intake or issues with absorption.
- Cognitive Decline: There is a well-documented connection between muscle strength and brain health. Studies suggest that lower grip strength in mid-life is associated with a higher risk of cognitive issues and dementia later on (3).
A landmark study published in The Lancet, which followed nearly 140,000 adults, found that grip strength was a stronger predictor of all-cause and cardiovascular mortality than systolic blood pressure (1). This drives home its profound value as a general health barometer.
By quantifying this metric, clinicians gain a powerful tool for early detection and intervention. Understanding the value of this data is the first step; the true objective of measurement is to turn these numbers into actionable health insights. When we move from a simple squeeze test to a standardized, data-driven protocol, we unlock its full potential to improve patient outcomes.
Mastering the Protocol for Accurate Measurement
Consistent, reliable data is the direct result of a standardized process. For grip strength testing to be clinically useful, every test must be performed the same way, every time. This approach eliminates variables that can skew results, ensuring the changes you track are genuine reflections of your patient's or athlete's progress.
A standardized protocol is your method for isolating the one variable that matters: maximal grip force.
The Gold Standard: The ASHT Protocol
The American Society of Hand Therapists (ASHT) established a widely accepted protocol for measuring grip strength. Following these steps is key to ensuring your data is both reliable (consistent) and valid (accurate). To appreciate this level of detail, it helps to review other comprehensive assessment protocols, as the principles of systematic, precise data collection apply across the board.
The standardized ASHT position involves a few key elements:
- Patient Seating: The person should be seated in a chair without armrests, with their feet flat on the floor. This creates a stable base and prevents them from using their body to generate extra force.
- Shoulder Position: The shoulder should be adducted and neutrally rotated, meaning it is held close to the side of the body without any twisting.
- Elbow Flexion: The elbow must be bent at a 90-degree angle, with the forearm in a neutral position (thumb pointing towards the ceiling).
- Wrist Position: The wrist needs to be held between 0 and 30 degrees of extension and between 0 and 15 degrees of ulnar deviation. This neutral alignment prevents biomechanics from giving an unfair advantage or disadvantage.
This specific posture is meticulously designed to isolate the action to the hand and forearm muscles, preventing larger muscle groups in the shoulder and torso from contributing. Even a slight deviation, like leaning the body or extending the elbow, can significantly affect the measurement.
Executing the Test Flawlessly
Once your patient is in the correct position, the test itself requires precision. The dynamometer should be handed to the patient so it fits comfortably in their hand.
The standard protocol calls for taking three separate measurements on each hand. It is crucial to allow a rest period of at least 60 seconds between each attempt to let the muscles recover and prevent fatigue from affecting the results. The average of these three trials is then recorded as the final score.
During each squeeze, clear and consistent verbal cues are vital. Simple phrases like "Squeeze as hard as you can!" or "Harder, harder, harder!" can motivate the person to give a true maximal effort. Without that encouragement, you might be capturing a submaximal attempt, which is not a true reflection of their peak strength.
For a detailed walkthrough, you can check out our complete guide on how to use a dynamometer.
Putting the Data in Context
The data gathered with this protocol is incredibly valuable because it can be compared against established norms. Grip strength is a simple yet powerful window into overall muscle function. It typically peaks in early adulthood and follows a predictable curve across the lifespan, making it a vital sign for physical therapists and sports coaches alike.
A large study combining data from twelve British cohorts showed that grip strength climbs steadily from childhood, reaching a peak median of 51 kg for males between ages 29 and 39. For females, the peak is 31 kg between ages 26 and 42 (4). After this peak, strength tends to plateau through midlife before declining, highlighting critical windows for intervention. This kind of normative data, gathered with standardized protocols, sets a global benchmark.
This lifecycle context is exactly why a single grip strength measurement is so powerful. It doesn't just tell you how strong someone is today; it shows you where they stand relative to their peers and their own expected strength curve. This insight allows you to set realistic goals, track recovery with confidence, and spot potential health risks before they become serious problems.
Choosing the Right Dynamometer for Your Practice
Selecting the right tool to measure grip strength is a critical first step toward obtaining meaningful data. Your choice of dynamometer will directly shape the accuracy, consistency, and efficiency of every assessment you perform. The decision usually comes down to two main options: traditional hydraulic dynamometers and their modern digital counterparts.
For decades, hydraulic dynamometers were the accepted standard in clinics and research labs. They are built robustly, using a sealed hydraulic system to measure grip force. When properly maintained, they are undeniably reliable.
However, their mechanical nature presents some practical challenges. Hydraulic units require frequent calibration to maintain accuracy, a process that can be time-consuming and costly (5). They can also develop oil leaks over time, which can compromise the device's accuracy and put it out of commission until repaired.
The Shift to Digital Precision
In recent years, digital dynamometers have become increasingly popular, solving many of the issues associated with hydraulic models. These devices use sophisticated electronic load cells or strain gauges to obtain a more direct and often more precise measurement of force.
This technological advancement offers significant advantages in a busy practice:
- Pinpoint Accuracy: Digital sensors provide a higher resolution and are less susceptible to the mechanical 'drift' that can affect hydraulic systems.
- Automatic Calculations: Many digital models instantly calculate and display the peak force, average force, and other key metrics, saving time on manual calculations.
- Effortless Data Logging: The ability to save results digitally and sync them to patient records reduces transcription errors and simplifies progress tracking.
The real advantage of digital dynamometry is that it minimises guesswork and manual work. It provides instant, objective numbers that can be stored, compared over time, and easily shown to a patient or athlete to enhance their engagement in their program.
This simplified workflow is highly beneficial when conducting back-to-back tests or working within a large team where consistency is paramount.
No matter which device you use, obtaining a reliable grip strength measurement always comes down to the same three simple phases.
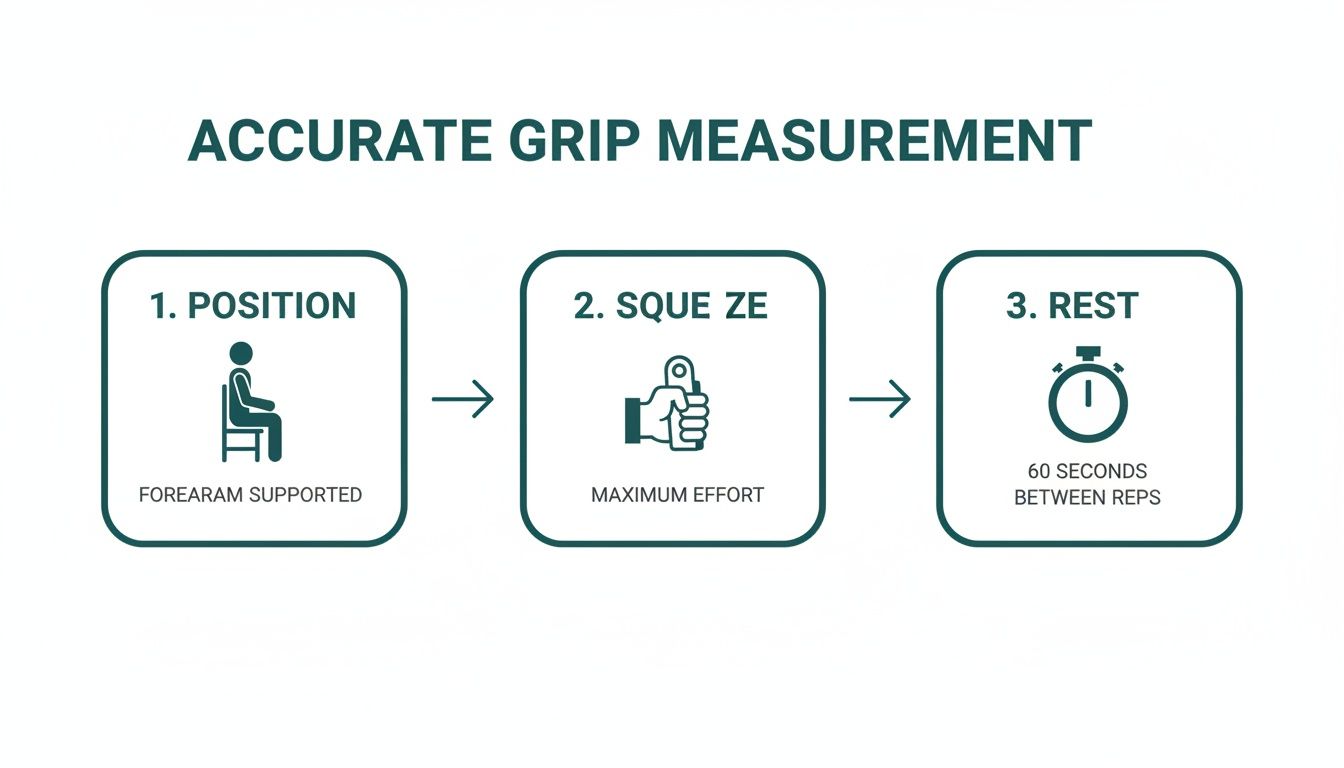
This illustrates that good data is not just about the tool itself—it's a product of standardized patient positioning, eliciting a true maximal effort, and allowing for proper rest between attempts.
Making an Informed Choice for Your Needs
So, which one is right for you? The answer depends on your specific needs and setting. If you want to dive deeper into the mechanics, you can learn more about how a dynamometer works in our detailed guide.
To help you decide, let's break down the key differences.
Comparison of Dynamometer Technologies
| Feature | Hydraulic | Digital |
|---|---|---|
| Accuracy | Good, but dependent on frequent calibration. | Excellent, with higher precision and less chance of drift over time. |
| Data Management | Manual recording, which is open to human error. | Data is automatically logged and easily transferred to patient records. |
| Ease of Use | Simple to operate, but requires manual reading of a dial. | Intuitive digital screen with automatic calculations. |
| Maintenance | Requires regular calibration and is at risk of oil leaks. | Minimal maintenance; often has a simple zeroing function. |
| Portability | Generally durable and portable for use outside the clinic. | Lightweight and extremely portable, suitable for any setting. |
For a research environment where new data needs to be compared with historical studies, a well-calibrated hydraulic unit may still be appropriate.
But for most modern physiotherapy clinics, sports rehabilitation facilities, or training centers, the advantages of a digital dynamometer are significant. The ability to capture accurate, repeatable data efficiently allows you to focus on what truly matters: interpreting the numbers and developing a plan that helps your clients achieve their goals.
How to Interpret Grip Strength Data

You have followed a standardized protocol and collected data from your grip strength measurement. Now for the most important part: what do these numbers actually mean? A raw score in kilograms or pounds is just a starting point. Its true clinical value is unlocked when you place it in the proper context, transforming a simple data point into a powerful insight about your patient’s health and functional capacity.
The key is comparing your client’s result against a large dataset from their peers. This is where normative data comes in—large-scale reference values collected from thousands of individuals. These norms act as your compass, telling you if a measurement is typical, exceptionally strong, or a potential red flag that warrants a closer look.
Understanding Norms and Demographics
Grip strength is not a one-size-fits-all metric. It is heavily influenced by a person’s age and gender. Strength naturally follows a predictable arc through life: it increases during childhood and adolescence, peaks in early to middle adulthood, and then begins a gradual decline.
Men also consistently demonstrate higher grip strength values than women across all age groups, a difference attributable to biological factors like muscle mass and hormones. Therefore, interpreting a score in isolation, without considering these demographic factors, would be like reading a map without a legend—the information is there, but its meaning is lost.
By comparing an individual's score to the average for their specific age and gender group, you can accurately gauge their standing. This process turns a number like "35 kg" into a meaningful statement like, "Your strength is above average for a man in his 50s."
This contextualization is essential for setting realistic rehabilitation goals. For an older adult recovering from a fall, the objective is not to match the strength of a 30-year-old athlete. The goal is to improve their standing within their own peer group, which is a much more motivating and clinically relevant target.
From Numbers to Percentiles
One of the most effective ways to interpret and communicate grip strength data is by using percentile rankings. This method translates a raw score into a simple, intuitive format that patients and clients can easily grasp.
Stating that someone is in the 80th percentile means their grip strength is greater than 80% of other people in their same age and gender category. It’s a powerful communication tool.
Here’s a simple breakdown:
- Below the 25th percentile: This may indicate a significant strength deficit and could be a marker for frailty or sarcopenia, especially in older adults.
- Between the 25th and 75th percentile: This range is generally considered average or typical.
- Above the 75th percentile: This suggests above-average to excellent strength for their demographic.
Using percentiles helps you move the conversation beyond abstract numbers. It allows you to frame progress clearly ("You've moved from the 40th to the 60th percentile!") and helps patients understand the significance of their efforts. For a deeper dive into specific values, you can explore detailed tables of dynamometer grip strength norms.
Applying Large-Scale Data in Practice
The benchmarks used by clinicians often come from massive population surveys, which provide the robust data needed to establish reliable norms. For instance, data from the National Health and Nutrition Examination Survey (NHANES) in the US showed that mean grip strength for men peaked at 51.8 kg and for women at 31.1 kg, both in the 30-39 age group (6).
This type of nationally representative data, gathered using standardized methods, forms a crucial evidence base for clinical interpretation.
By leaning on these normative values, you can confidently identify individuals who fall below critical thresholds, flagging them for further assessment. This objective data is also invaluable for demonstrating the effectiveness of your interventions over time. A clear, graphed improvement in percentile rank is compelling evidence of progress for the patient, the clinician, and even insurance providers. Ultimately, the goal is to move from simply measuring to truly understanding what that grip strength measurement reveals about a person's health journey.
Integrating Grip Strength into Clinical Practice
Knowing the theory behind grip strength is one thing, but its practical application is where the value lies. This simple, objective test can become a critical piece of the clinical puzzle across a surprisingly wide range of disciplines. It's about turning subjective feelings into quantifiable data that sharpens your clinical reasoning, improves patient communication, and justifies your treatment plans with hard evidence.
When we integrate grip strength testing into daily practice, we can move past vague assessments and base decisions on reliable, repeatable data. This shift not only elevates the quality of care but also provides the solid documentation needed to prove progress and demonstrate clinical necessity.
Physical Therapy After a Wrist Fracture
Imagine a physical therapist working with a patient recovering from a distal radius fracture. After the cast is removed, the patient almost always experiences significant weakness, pain, and a loss of function. A subjective comment like, "my wrist feels weak," is a starting point, but it provides no objective measure to track recovery.
This is where grip strength measurement excels.
During the initial evaluation, the therapist can obtain a baseline reading on both the injured and uninjured sides. This immediately quantifies the strength deficit, giving everyone a clear starting line. For instance, the injured side might read 12 kg while the uninjured side measures 35 kg—instantly revealing a significant strength deficit.
This objective data becomes the cornerstone of the entire treatment plan. As the patient progresses through their rehabilitation exercises, the therapist can re-test weekly or bi-weekly. Watching those numbers climb—from 12 kg to 18 kg, then to 25 kg—is incredibly motivating for the patient. For the therapist, it's clear, undeniable proof that the interventions are effective.
Sports Performance and Athlete Readiness
In the world of sports, small margins can make a big difference. A sports performance coach can use grip strength as a quick, non-fatiguing indicator of an athlete's central nervous system readiness. A sudden, unexplained dip in grip strength can be an early warning sign of overtraining or systemic fatigue, often before the athlete even reports feeling burned out.
Consider a rock climber whose grip is consistently around 60 kg. If they suddenly test at 52 kg at the start of a training week, that drop should prompt the coach to investigate. It might be a signal to reduce the training load for that session and prioritize recovery, potentially preventing an injury or a performance slump. It acts as a simple, daily check-in on the athlete's recovery status.
This metric is also crucial for return-to-play decisions after an upper-body injury. Having objective data that shows an athlete’s grip strength has returned to at least 90% of their pre-injury baseline provides a clear, defensible reason to clear them for competition.
Geriatric Care and Frailty Screening
In geriatric care, grip strength is a vital screening tool for identifying frailty and sarcopenia. An older adult's ability to perform daily activities—opening a jar, carrying groceries, or even pushing up from a chair—is directly linked to their overall strength. A low grip score is a powerful predictor of functional decline, increased fall risk, and even hospitalization (7).
A geriatrician or primary care physician can easily incorporate a grip test into a routine annual check-up.
- Routine Screening: A quick test can flag at-risk individuals who could benefit from a targeted strength program or nutritional counseling.
- Thresholds for Intervention: For men, a grip strength below 27 kg, and for women, below 16 kg, are often used as clinical alert thresholds for sarcopenia according to the European Working Group on Sarcopenia in Older People (2).
- Monitoring Health Trajectory: Tracking this number over the years can reveal a patient's long-term health trajectory, enabling early interventions to help them maintain independence and quality of life.
A Window into Overall Systemic Health
Beyond these specialized fields, grip strength is gaining recognition as a general biomarker of systemic health. A growing body of research suggests that a weaker grip can be associated with a higher risk for depression and cognitive decline (3,8). While it is not a diagnostic tool on its own, it can be a valuable clue.
For a primary care provider, a surprisingly low grip reading in a middle-aged adult during a routine physical could be a prompt to dig a little deeper. It might spark questions about their nutrition, physical activity level, or lead to a mental health screening. This simple, two-minute test can open the door to a more holistic view of a patient’s health, turning a routine visit into an opportunity for proactive care.
References
- Leong DP, Teo KK, Rangarajan S, et al. Prognostic value of grip strength: findings from the Prospective Urban Rural Epidemiology (PURE) study. Lancet. 2015;386(9990):266-73.
- Cruz-Jentoft AJ, Bahat G, Bauer J, et al. Sarcopenia: revised European consensus on definition and diagnosis. Age Ageing. 2019;48(1):16-31.
- Duchowny KA, Ackley SF, Brenowitz WD, et al. Associations Between Handgrip Strength and Dementia Risk, Cognition, and Neuroimaging Outcomes in the UK Biobank Cohort Study. JAMA Netw Open. 2022;5(6):e2218314.
- Dodds RM, Syddall HE, Cooper R, et al. Grip strength across the life course: normative data from twelve British studies. PLoS One. 2014;9(12):e113637.
- Mathiowetz V. Comparison of Rolyan and Jamar dynamometers for measuring grip strength. Occup Ther Int. 2002;9(3):201-9.
- Wang YC, Bohannon RW, Li X, et al. Hand-Grip Strength: Normative Reference Values and Equations for the Chinese Adult Population. J Phys Ther Sci. 2017;29(8):1370-1375.
- Bohannon RW. Grip strength: an indispensable biomarker for older adults. Clin Interv Aging. 2019;14:1681-1691.
- Firth J, Solmi M, Wootton RE, et al. A meta-review of observational and Mendelian randomization studies of the association between muscular strength and mental health. Mol Psychiatry. 2020;25(5):1073-1087.
Common Questions About Grip Strength Testing
Even with the best tools and a solid protocol, questions often arise when implementing grip strength testing in a busy clinic or training facility. Addressing these common queries will help you fine-tune your technique, increase your confidence, and ensure the data you're collecting is robust.
Let’s dive into some of the most frequent questions from practitioners and provide straightforward, evidence-based answers.
How Often Should a Dynamometer Be Calibrated?
Calibration is the foundation of your data's accuracy—it's what guarantees the force the device reads is the actual force being applied. For traditional hydraulic dynamometers, the general recommendation is annual calibration. However, if the device is used heavily or is dropped, checking it more frequently is advisable.
A clear sign that a hydraulic unit needs immediate attention is if the needle does not return to zero after a squeeze. Digital dynamometers are a different story; their solid-state electronics tend to hold their calibration for much longer. You should always follow the manufacturer’s guidelines, but most have a simple zeroing function that must be used before each test to ensure a clean baseline.
Always document your calibrations. It’s a critical part of good clinical practice and quality assurance, validating your data for clinical records, research, or any potential audits.
What Are the Most Common Testing Mistakes to Avoid?
Almost every significant error in grip strength measurement comes down to one thing: deviating from the protocol. Consistency is paramount. Even small variations can affect your data, making it impossible to track real changes over time.
To keep your results valid and reliable, be meticulous about avoiding these common mistakes:
- Inconsistent Positioning: Allowing the patient’s arm, wrist, or body to shift between tests is the number one source of error. You must enforce the same standardized position for every single measurement, every single time.
- Variable Verbal Cues: A person’s motivation significantly influences their maximal effort. Using the same strong, consistent encouragement—like "Squeeze as hard as you can!"—for every trial is essential for obtaining their true peak performance.
- Insufficient Rest: Skipping the recommended 60-second rest period between attempts can lead to fatigue. This can result in artificially low scores on later trials and skew the final average.
- Forgetting to Zero the Device: This is a simple but critical step. If you don't zero the dynamometer before a new measurement, your reading will be inaccurate from the start.
How Do I Document and Bill for This Measurement?
Clear and thorough documentation is essential, both for tracking a patient’s progress and for billing purposes. Your notes need to provide a complete picture of the testing session, leaving no room for questions later.
Every note should include these key details:
- The date of the measurement.
- The specific device used (e.g., brand and model).
- The exact patient position during the test.
- The hand being tested (right or left).
- The result of each individual trial.
- The final calculated value (e.g., the average or the peak score).
Don't just stop at the numbers. The clinical value comes from interpreting the data. You should compare the result against normative data for the patient's age and gender to provide context.
In many physical therapy settings, an assessment like this may be billed using a code such as CPT code 97750 (Physical Performance Test or Measurement). However, it is crucial to check the specific billing rules with individual insurance payers, as coverage can vary. Well-documented, objective data showing functional changes over time is your most powerful tool for justifying the clinical necessity of your care.
At Meloq, we believe that replacing subjective guesswork with quantified, objective data is the key to better outcomes. Our digital measurement tools, like the EasyForce dynamometer, are designed to help you gather accurate and repeatable data with ease, so you can focus on what truly matters—your patients and athletes. Discover how you can elevate your practice by visiting meloqdevices.com.

Featured Product
EasyForce Digital Dynamometer
Handheld muscle strength testing with 99% accuracy. Used in 40+ peer-reviewed studies.
Learn More