
Gait Analysis Force Plate Guide for Diagnostics and Performance
Team Meloq
Author
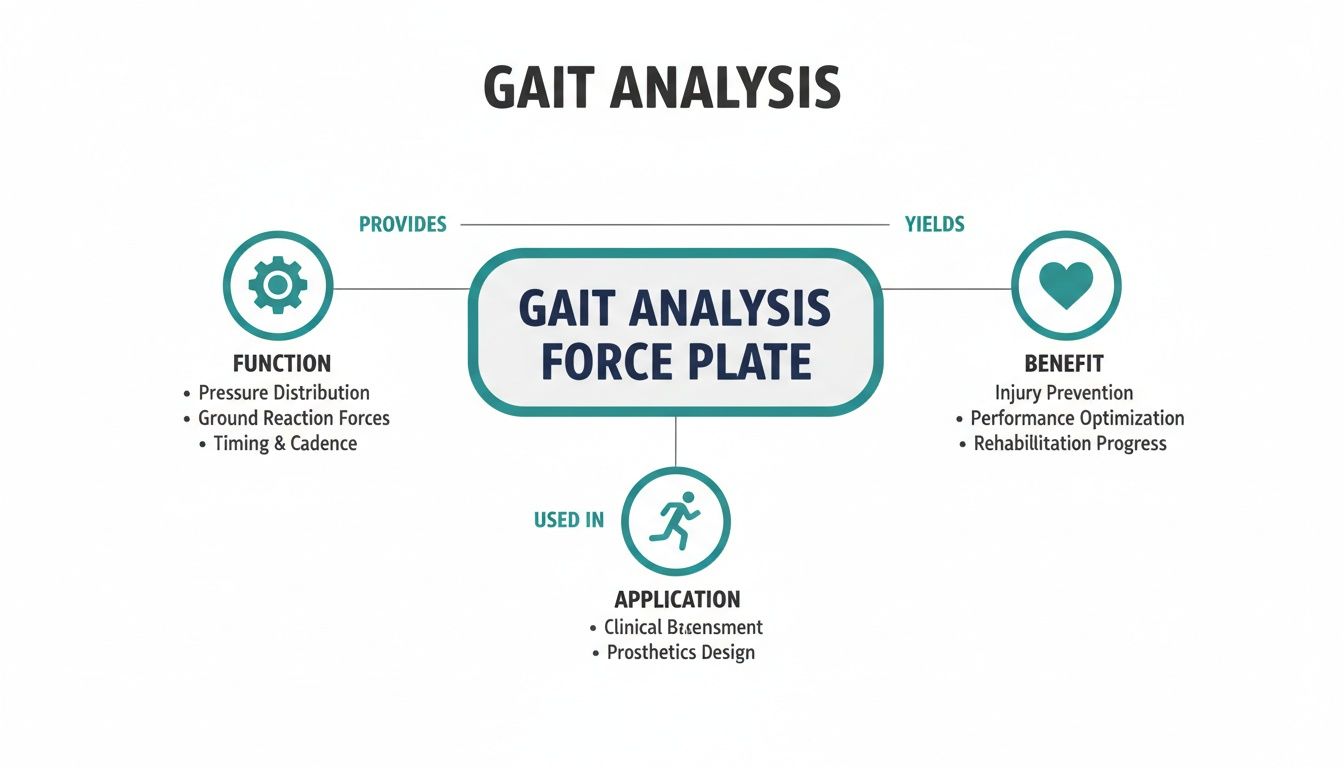
Quick Overview Of Gait Analysis Force Plate
Gait analysis force plates capture ground reaction forces with remarkable precision on every step. Clinicians and sports scientists turn these quantitative data into actionable insights for rehab protocols and performance tweaks.
Picture swapping a simple visual check for a live graph that tells you exactly when weight shifts from heel to toe. That’s the power of a force plate: it measures load under each foot, tracks timing events, and uncovers subtle balance patterns.
From Observation To Quantitative Assessment
Until the late 20th century, gait studies depended largely on keen eyes and stopwatches. By the 1990s and 2000s, clinical labs had married force plates with motion‐capture cameras and EMG, enabling richer diagnostics in neuromotor and orthopedic care[4]. For a deep dive into the underlying biomechanics, check out our detailed guide on force platforms in biomechanics.
“Objective force data shift us from visual estimates to decisions rooted in real numbers.”
Key Clinician Benefits
Integrating force‐plate insights into your workflow means you can:
- Pinpoint peak forces and impulse to flag gait asymmetries
- Follow the center of pressure path for a clear balance assessment
- Time critical gait events like heel strike and toe‐off down to the millisecond
For a comprehensive market overview, see DataInsightsMarket.
Below is an at-a-glance view of core functions, their benefits, and where they shine in practice.
Gait Analysis Force Plate Overview
| Function | Benefit | Application |
|---|---|---|
| Ground Reaction Force (GRF) | Quantifies how much load is applied | Orthopedic rehab and sports performance |
| Center of Pressure (CoP) | Maps balance shifts and stability | Fall risk testing and neuromuscular training |
| Temporal Event Timing | Records phase durations | Return-to-sport readiness protocols |
Bringing force‐plate data into your clinic or lab sharpens goal setting and tracks progress session by session. Patients and athletes see instant feedback, so every drill becomes more targeted and informative.
In upcoming sections, we’ll unpack specific metrics like loading rates, symmetry indexes and temporal parameters. We’ll also share real data examples—from human rehab to animal studies—and practical tips on selecting and integrating a portable force plate into your practice. Stay tuned!
Ground Reaction Forces And Center Of Pressure
Force plates give us a window into how our feet hammer, brake, and balance against the ground. Two core signals—Ground Reaction Forces (GRF) and Center Of Pressure (CoP)—tell the full story of each step.
Think of GRF as the invisible pushback underfoot, and CoP as the moving contact point where that force travels during stance.
Ground Reaction Force Signals
GRF breaks down into three axes, each painting a different biomechanical picture:
- Vertical GRF captures landing impact and push-off power, often 1.1–1.5× body weight in walking[1].
- Anterior-Posterior GRF splits into a braking phase early in stance and a propulsive phase later on[2].
- Mediolateral GRF highlights side-to-side shifts that flag stability issues.
By examining these forces together, clinicians can spot compensation patterns or uneven loading that simple observation might miss.
Center Of Pressure Path
CoP traces the net force “footprint” from heel to toe. Visualize drawing your foot in wet sand—your pressure point slides forward as weight transitions.
- Excursion Range quantifies total CoP travel for a balance check.
- Medio-Lateral Drift measures side-to-side sway and neuromuscular control.
- Path Length sums overall postural strategy throughout stance.
Below is an infographic showing how function, benefit, and application nodes connect around gait analysis force plate data.
Impulse Curves And Timing Events
An impulse curve is simply the area under a GRF-vs-time graph, representing total force load during stance. Braking impulse typically occurs in the first 10–15% of stance, while propulsive impulse peaks around 40–60%[2].
- 0% Stance – Heel strike introduces the first load.
- 20–30% Stance – Mid-stance reveals weight transfer and balance.
- ~60% Stance – Toe-off marks the shift to push-off power.
Impact Of Sampling Rate
Capturing data at the right speed makes all the difference in curve clarity. Too slow, and you’ll miss crucial spikes; too fast, and you’ll drown in data.
- Below 500 Hz risks aliasing artifacts[4].
- 600 Hz is fine for walking trials.
- 1000–2000 Hz suits running protocols.
- Always apply anti-alias filters to tame high-frequency noise.
Getting your sampling and filtering dialed in ensures crisp GRF and CoP curves you can trust.
Together, GRF and CoP signals build a dynamic map of movement mechanics. They set the stage for digging into peak forces, loading rates, and symmetry parameters next.
Check out our guide on how to calculate force applied in gait analysis force plate assessments for detailed formulas and examples: Learn More About Force Calculations
“GRF and CoP together reveal both the load pattern and balance strategy in each gait cycle.”
Key Metrics From Force Plate Data
Raw force-plate recordings only tell part of the story until we translate them into numbers that matter—like peak forces and timing events. Once you have those figures, you can pinpoint exactly how the body handles load during each step.
Before we dig deeper, let’s line up the most common force-plate metrics and see how they fit into clinical and performance settings.
Comparison of Key Force Plate Metrics
Overview of common metrics used in gait analysis and their clinical and performance applications
| Metric | Definition | Clinical Application |
|---|---|---|
| Peak Vertical GRF | Maximum vertical force during stance | Detects overload in orthopedic rehab |
| Loading Rate | Rate of force increase in the first 20–30 ms | Monitors stress on bone and soft tissue |
| Braking Force | Peak negative anterior-posterior force after heel strike | Guides gait retraining for injured patients |
| Propulsive Force | Peak forward thrust just before toe-off | Informs sprint and power training protocols |
Peak And Temporal Metrics
When your foot hits the ground, force doesn’t appear instantly—it ramps up. The loading rate measures how steeply that force climbs, calculated as the slope of the force–time curve in the first 20–30 ms. High loading rates often flag excessive stress on bone and soft tissue.
Stance time and double-support duration, meanwhile, reveal how evenly a person shares weight between legs. Shorter or longer times here can hint at compensation patterns or balance issues.
- Peak Vertical GRF: Often 1.1–1.5× body weight in walking[1].
- Loading Rate: Δ force/Δ time in the initial 20–30 ms.
- Braking Force: Peak anterior-posterior negative load right after heel strike.
- Propulsive Force: Peak forward thrust just before toe-off.
Symmetry And Balance Indicators
Assessing left-to-right balance is crucial. The Bilateral Symmetry Index (BSI) calculates asymmetry as:
BSI = |Left – Right| ÷ (Left + Right) × 100%
Clinically, a BSI below 10–15% is often targeted before clearing someone for full return to sport[3].
“Asymmetry thresholds above 15% can indicate incomplete rehabilitation and higher injury risk.”
Another useful signal is how far the Center of Pressure (CoP) travels underfoot. Larger CoP excursions often point to balance challenges or neuromuscular deficits.
High-quality force plates capture vertical, anterior-posterior, and mediolateral GRFs with sub-Newton resolution at 600–2000 Hz, making it possible to spot even the smallest imbalances or abrupt changes in loading.
For more on the science behind these signals, check out Learn more about force plate science on Bertec’s blog.
Clinical Thresholds And Applications
Small shifts in numbers can carry big implications. Clinicians often use these guidelines:
- Aim for BSI < 10% before returning to sport[3].
- Flag any > 15% increase in loading rate as a red alert.
- Watch for stance time changes over 50 ms as signs of instability.
For a deeper dive into how quickly force develops, see Learn about Rate of Force Development.
Real World Calculation Example
Picture an 80 kg athlete stepping onto a force plate. Their peak vertical GRF hits 1200 N—that’s 1.5× body weight. If force climbs from 200 N to 800 N in 0.02 s, the loading rate is 30 000 N/s.
This same athlete shows a 12% BSI, exceeding the 10% goal and revealing delayed off-loading on one limb. A therapist might add drills that force even loading between legs.
“In practice, having clear numbers transforms subjective cues into precise targets.”
Over four weeks, a 5% drop in loading rate would hint at improved shock absorption and tissue adaptation, guiding the safe progression to more dynamic exercises.
Integrating Metrics Into Practice
Numbers only gain power when you turn them into action. Try these tips:
- Schedule baseline tests and retest every 2–4 weeks.
- Set clear asymmetry and loading rate targets for each session.
- Share snapshot reports to keep clients motivated and informed.
Pair force-plate data with video feedback, and you’ll create a more engaging, objective roadmap for recovery or performance gains. With consistent use, these metrics become as instinctive as checking a pulse—and just as vital.
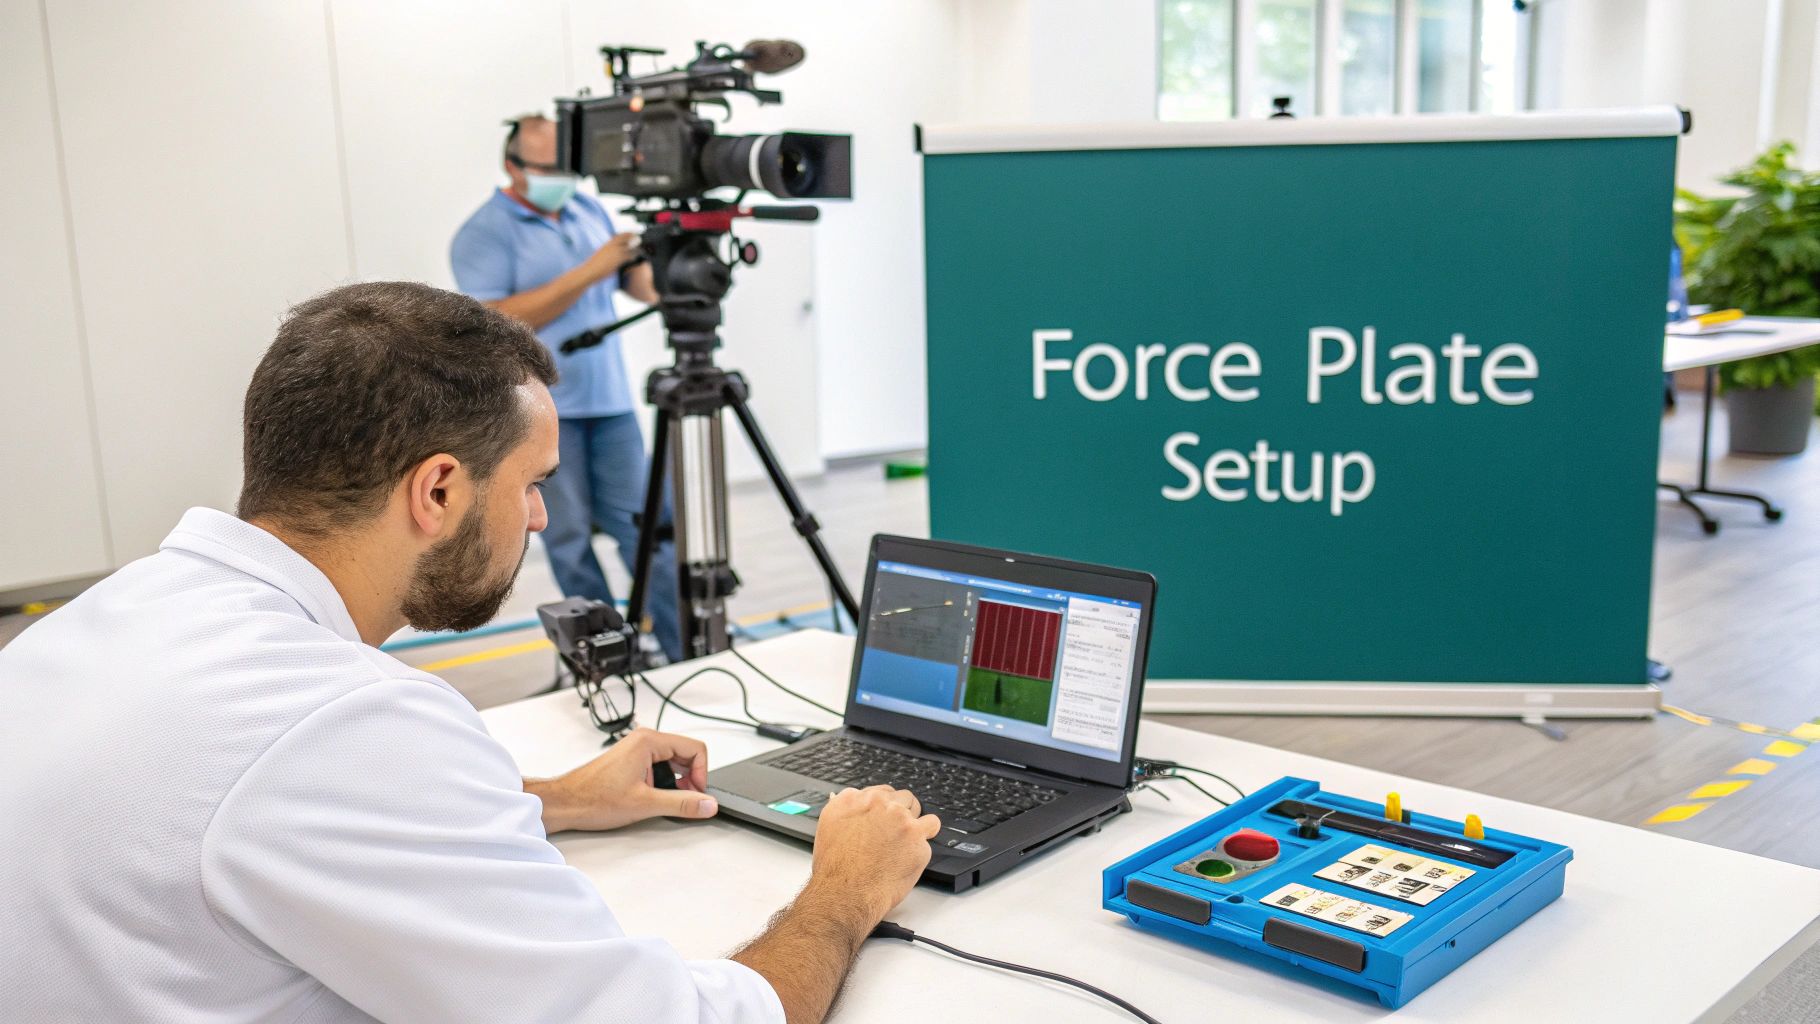
Setting Up Force Plate For Gait Assessment
Getting reliable gait data starts long before anyone steps onto the plate. A solid setup—whether in a busy lab or out on the field—ensures the numbers you capture truly reflect how someone walks or runs.
Even with portable units outdoors or fully embedded systems in a biomechanics lab, you must keep surface stability, plate alignment, and orientation in check. Small details here prevent big headaches later.
Equipment Calibration
If calibration drifts, every trial becomes suspect. I always begin each session with a quick zero-point check.
- Place a certified weight on the plate and note the raw output.
- Tweak the system gain until the displayed force equals the known mass.
- Perform a multi-point check at 25%, 50%, and 75% of capacity.
Resetting these values before every experiment stops gradual drift and keeps your baseline honest.
Integration And Alignment
To get the full story of someone’s gait, pair the force plate with motion-capture cameras or timing gates. Sync pulses or wireless triggers will lock kinetic and video data together frame by frame.
- Ensure the plate is perfectly level and sits flush with the surrounding floor.
- Confirm all trigger cables or sync LEDs are connected and firing.
- Double-check device orientations—rotations of even a few degrees distort center-of-pressure paths.
Proper alignment tames edge effects and delivers crisp ground-reaction-force curves.
“Calibration drift can erode data fidelity in minutes—check it often.”
Standardizing Trials
Consistency is the name of the game. Controlling speed, footwear, and foot placement means faster, fairer comparisons across trials.
- Use a metronome or timing gates to lock in a constant gait speed.
- Mark key anatomical spots—heel, first metatarsal, lateral malleolus—on the walkway.
- Have participants don the same shoes or go barefoot to match your protocol.
Run each condition 3–5 times. Averaging across trials smooths out natural variations and highlights true asymmetries.
Comparing Surface Types
Your mounting surface acts like a lens for ground-reaction forces—it can sharpen or soften the picture.
| Surface Type | Stability Level | Best Use |
|---|---|---|
| Concrete | High | Fixed lab installations |
| Wooden Slab | Medium | Short-term field deployments |
| Rubber Mat | Low | Balance drills and stability work |
Concrete keeps vibration and drift to a minimum. Wooden slabs introduce flex (watch for ±2 N shifts). Mats add compliance and can shave off your force peaks.
Quality Assurance
A proper warm-up primes the neuromuscular system and cuts down on erratic first steps. Light jogging or dynamic stretches loosen everyone up.
- Watch raw signals for sudden spikes or flat lines—signs of noise or sensor dropout.
- Look at zero-force intervals between steps to spot baseline drift.
- Pause the test if you observe more than ±5 N of random fluctuation.
Mid-run sanity checks and quick recalibrations catch problems before they ripple through your dataset.
For an in-depth look at advanced calibration routines and troubleshooting, see our detailed guide on force plate testing.
Preparing For Analysis
Once you’ve wrapped up data collection, don’t let those files sit in limbo. Label each dataset with Participant ID, trial number, and date—and back up everything immediately.
- Organize by session and subject folders for fast retrieval.
- Adopt a naming convention like
PID_Date_Trialto keep things crystal clear.
A tidy file structure speeds up post-processing and reporting—and gives you confidence that your numbers tell the real story of biomechanics. With set-up nailed down, you’re ready to dive into interpreting those force curves and uncover clinical insights.
Interpreting Force Plate Data With Real Examples

Clinical narratives give meaning to the spikes and valleys in a force-time curve. Without context, raw numbers can feel disconnected from a patient’s daily function.
In the sections that follow, we walk through four real-world cases. Each scenario ties curves and metrics back to practical goals in rehab or sport performance.
Value Of Narrative Context
Combining a patient’s story with their force-time readout brings clarity. Suddenly, a graph isn’t just data—it reflects how someone moves through the world.
Child With Cerebral Palsy
A 10-year-old with spastic diplegia stepped onto the plate to determine surgical timing. We found a 25% asymmetry in peak vertical GRF, revealing uneven loading and early stance challenges.
When the second vertical GRF peak arrived 0.05 s later than typical, it flagged push-off weakness. Those insights guided the choice between selective dorsal rhizotomy and tendon lengthening.
- Takeaway: Consider surgery when asymmetry exceeds 20%[5].
- Protocol: Collect at least 5 walking trials to reduce variability.
- Visualization: Overlay curves to highlight stance-phase delays.
ACL Reconstruction Return To Sport Decision
Six months post-ACL reconstruction, an athlete performed single-leg hops on the force plate. The symmetry index for peak anterior-posterior braking force hit 12%, just above the 10% safety threshold. Further analysis showed a delayed loading rate on the injured side—35 000 N/s versus 28 000 N/s on the healthy limb. This guided a six-week neuromuscular program before full field drills.
“Aim for symmetry indices under 10% to reduce re-injury risk,” says Dr Harris, OCS[3].
Sprint Technique Refinement
Mid-season testing with a sprinter uncovered high early-stance braking forces. The force-time graph spiked 15% above previous measures, signaling a tweak in start block angles and foot-strike drills. Trimming ground contact by as little as 5 ms can shave precious hundredths off split times[6]. We recommend pairing on-field plate drills with video feedback for faster adaptation.
- Record 3 race-pace sprints and overlay force-time curves.
- Flag early-stance peaks exceeding 2.0 N/kg.
- Apply foot-placement cues and reassess after 2 weeks.
Canine Cruciate Injury Therapy
A dog recovering from a cruciate injury showed 30% larger center-of-pressure excursions on the injured side, indicating weight-shift compensation. Veterinary research highlights that dogs tend to favor their healthy limb, increasing joint loads over time[7]. Turning these numbers into focused balance and weight-shift drills improved limb-loading symmetry by 18% within six weeks.
| Metric | Healthy Limb | Injured Limb |
|---|---|---|
| CoP Excursion | 40 mm | 52 mm |
| Swing Time | 0.36 s | 0.41 s |
Practical Application Tips
- Document context: always tie metrics back to function or patient complaints.
- Visualize trends: overlay sessions to track improvements.
- Review thresholds: compare values against normative data or published cutoffs.
- Schedule retests regularly to confirm curve changes match functional gains.
- Combine force plate data with video and EMG for a richer biomechanical picture.
- Share curves with patients to boost engagement and adherence.
- Log all settings, from sampling rate to filter parameters, for transparency.
- Celebrate milestones: use data-driven wins to keep motivation high.
Key Insight: Real-world examples turn force plate data into personalized treatment and performance plans.
Always interpret plate metrics alongside clinical exams and imaging to keep the focus on the person, not just the numbers.
Avoiding Common Pitfalls And Choosing The Right Force Plate
Introducing a force plate into your gait lab can feel a bit like adding a high-precision camera to your workflow. At first glance, everything seems perfect—until you notice small drifts or an uneven floor blurring your ground reaction force and center of pressure readings.
Catching these quirks early means you’re building decisions on rock-solid data, not background noise. And that reliability can be the difference between a confident clinical recommendation and a puzzled double-check.
Identifying Common Measurement Errors
Calibration drift sneaks in over weeks or months. A quick zero-check before each session can flag shifts as small as a few Newtons.
Vibrations from the floor or a loosely mounted plate can introduce ±2 N of error in peak force. Even placing your portable system on a slightly springy wooden board can throw off balance metrics.
Then there’s human variability—different trial speeds or mismatched shoes. Here’s how to tighten things up:
- Verify the zero offset before every trial.
- Mount plates flush on concrete or a firmly secured wooden panel.
- Calibrate at 25%, 50%, and 75% of capacity.
- Standardize participant speed (use timing gates) and shoe condition.
Force Plate Type Comparison
When it comes to force plates, one size rarely fits all. You’ll typically see three main varieties, each with its own trade-offs.
Below is a side-by-side snapshot to help clarify which style matches your needs.
Force Plate Type Comparison
| Plate Type | Portability | Precision | Typical Cost |
|---|---|---|---|
| Embedded Lab Plates | Low | High (±0.5 N) | $20k–$40k |
| Portable Dual-Plate | Medium | Medium (±2 N) | $15k–$30k |
| Advanced 3D Plates | High | Very High (±0.1 N) | $40k–$70k |
This market breaks down into embedded, portable single/dual, and advanced 3D plates. In fact, the 3D segment hit USD 120 million in 2024 and is projected to reach USD 250 million by 2033, growing at a ~10.5% CAGR[8].
Decision Matrix For Your Practice
Picking a system isn’t just about price tags—it’s about matching features to your day-to-day demands.
Embedded plates shine when precision and stability are non-negotiable. If you need quick sideline or outdoor testing, portable models can be up and running in under 5 minutes. And for clinics craving multi-axis data—think jump analysis or intricate kinetic studies—advanced 3D plates make sense, though they can bump up costs by 30%.
Ask yourself:
- How tight must your peak force and impulse measurements be?
- Will you move the equipment between locations?
- What’s your total cost of ownership?
- Do you need real-time feedback or seamless software integration?
- How many trials do you run daily, and how fast must calibration be?
A simple scoring matrix—rating each factor 1–5—can shine a light on your best fit. Then revisit that score every year or so to see if new firmware or plate designs have shifted the balance.
“Reliable gait metrics begin with a stable platform and consistent setup procedures,” emphasizes Dr. Morales, PT, PhD.
With these checks in place, you’ll dodge the most common force-plate missteps and invest wisely in a system that genuinely elevates your gait analysis and patient outcomes.
Next up: a deep dive into sampling rates and integration tips to round out your force-plate toolkit. Stay sharp on calibration schedules and hygiene practices to keep every result above reproach.
Frequently Asked Questions
What Sampling Rate Is Best For Gait Analysis Force Plates?
When you’re capturing walking or running dynamics, aim for 600–1000 Hz to balance signal clarity and manageability[2].
How Do I Interpret Bilateral Symmetry Indices?
We calculate the Bilateral Symmetry Index (BSI) as
|Left − Right| / (Left + Right) × 100%[3].
In most clinics, asymmetries under 10% are seen as acceptable for return-to-sport. Once you hit 15% or more, it’s a sign to look closer at lingering deficits or compensations.
Key Sampling Rates And Symmetry Thresholds
- 600–1000 Hz: Captures gait events and peak forces cleanly
- < 10% Asymmetry: Generally cleared for sport activities
- 10–15%: Indicates need for targeted neuromuscular retraining
- > 15%: Flags compensatory movement patterns that could elevate injury risk
Can I Use Portable Plates Outdoors?
Absolutely. Portable force plates perform well on firm, level surfaces like asphalt or packed turf. Just remember to run an on-site calibration and secure the plate to reduce vibration noise.
How Do I Integrate Force Plate Data With Motion Capture?
Think of kinetic and kinematic streams as stereo channels—you want them in perfect sync. Use trigger cables, wireless sync modules, or shared timestamps. Then place reflective markers on key anatomical landmarks to link center-of-pressure shifts with joint angles and limb trajectories.
“Accurate synchronization of kinetic and kinematic data is fundamental,” notes Dr. Patel, PT, PhD.
What’s The Best Way To Troubleshoot Calibration Issues?
Always start with a zero-point check. Then verify at 25%, 50%, and 75% of the plate’s capacity. This multi-point approach confirms linearity and stability across your measurement range, preventing drift over time.
Each FAQ highlights critical checkpoints—but it’s no substitute for a full protocol. Be sure to review your device manual before conducting assessments.
Ready to streamline your clinical workflow with precise, portable measurement tools? Explore Meloq’s EasyBase, the portable force plate designed for clinicians who demand accuracy in every trial.
References
- Winter DA. Biomechanics and Motor Control of Human Movement. 4th ed. Hoboken: Wiley; 2009.
- Kerrigan DC, Todd MK, Della Croce U, Lipsitz LA. Biomechanical gait alterations independent of speed in the healthy elderly: evidence for specific limiting impairments. Arch Phys Med Rehabil. 1998;79(3):317–22.
- Patterson KK, Gage WH, Brooks D, Black SE, McIlroy WE. Evaluation of gait symmetry after stroke: reliability and validity. Gait Posture. 2010;31(2):241–6.
- Nigg BM, Herzog W. Biomechanics of the Musculo-skeletal System. 3rd ed. Chichester: Wiley; 2007.
- Gage JR. Gait analysis in cerebral palsy. Clin Orthop Rel Res. 2004;(424):4–10.
- Bezodis NE, Kerwin DG, Salo AI. Lower-limb mechanics during the support phase of sprinting. J Appl Biomech. 2008;24(2):161–76.
- May C, Butala S, Liscinsky A, Koch TG. Ground reaction forces in dogs with cruciate ligament deficiency. Am J Vet Res. 2002;63(8):1118–26.
- DataHorizzon. 3D force plate market trends [Internet]. 2024 [cited 2024 Jun 20]. Available from: https://datahorizzonresearch.com/3d-force-plate-market-24296

Featured Product
EasyBase Force Plates
Portable dual force plate system for jump testing, balance & rehab. No subscription fees.
Learn More