
A Complete Guide to the Force Platform Vertical Jump
Team Meloq
Author
A force platform vertical jump test provides a high-speed, data-rich insight into an athlete's power, moving far beyond simply measuring how high they can get off the ground. It captures the hidden forces at play, revealing how an athlete produces that explosive strength. This is why it has become a gold standard assessment in elite sports science and rehabilitation (1).
Why Top Practitioners Trust the Force Platform Vertical Jump
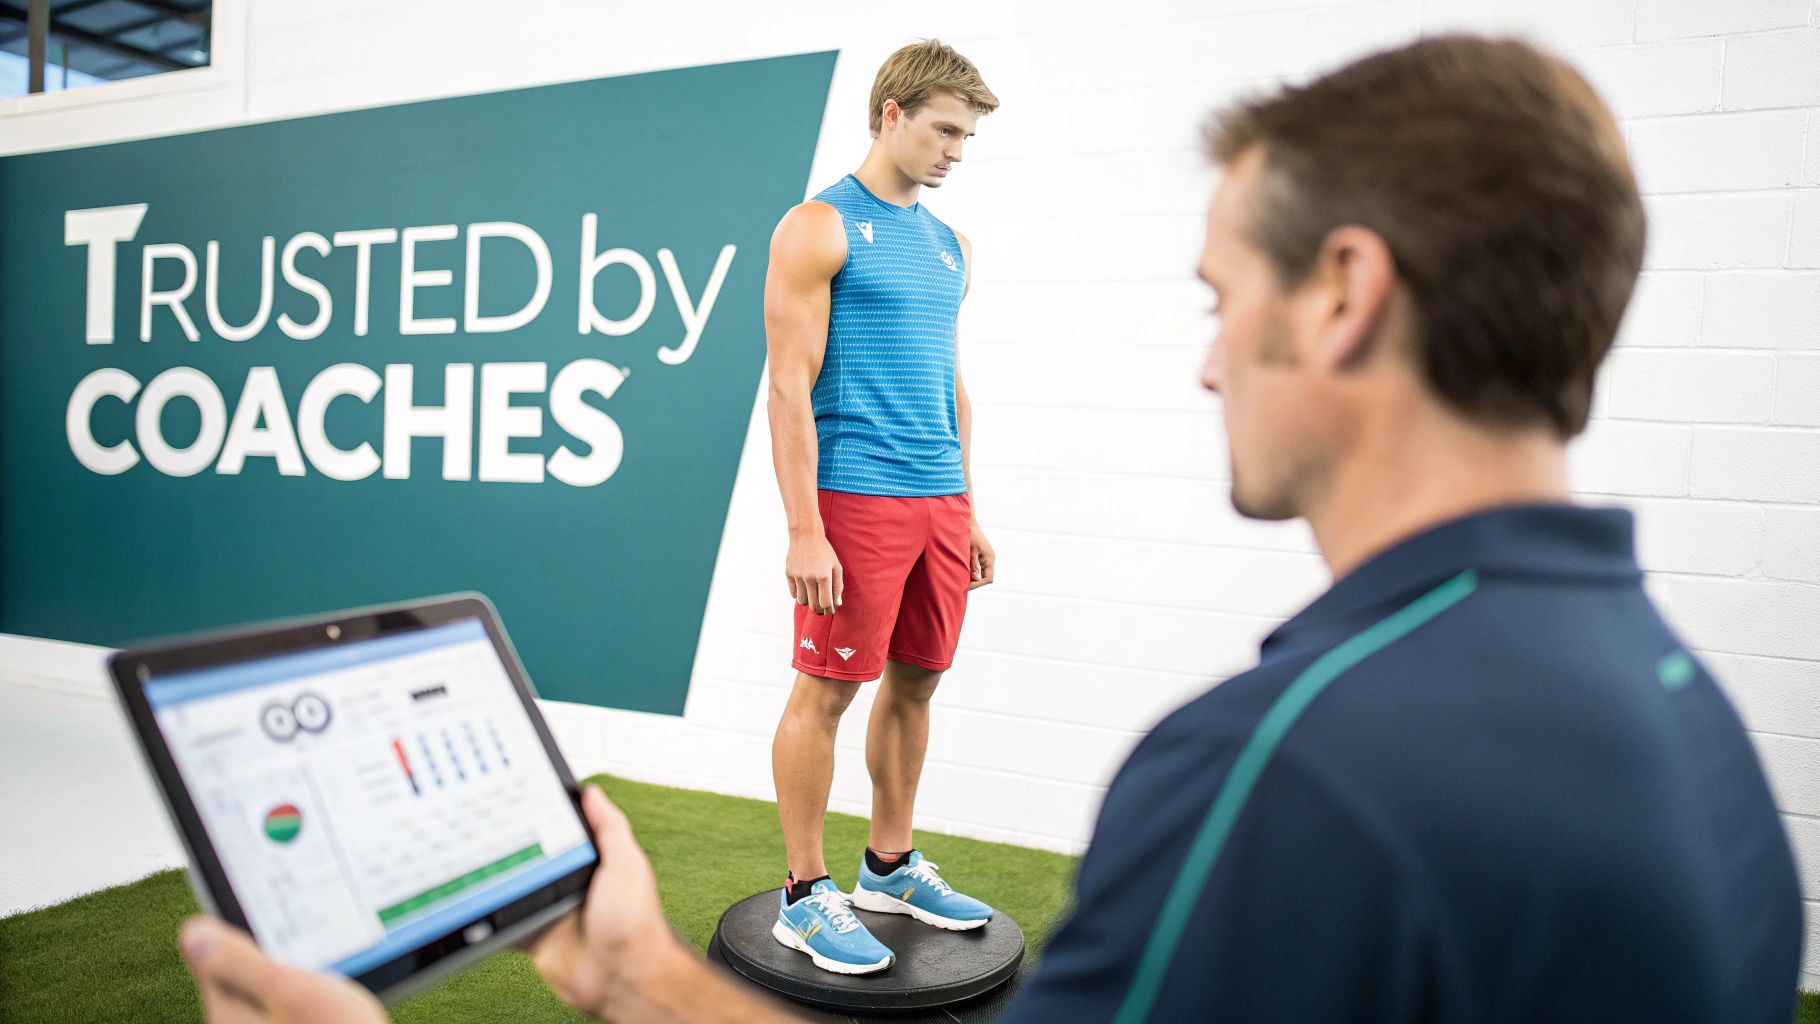
Imagine trying to understand a car’s performance just by clocking its top speed. You would know it's fast, but you wouldn't understand why. Is it the engine size? The fuel injection system? The aerodynamics? A force platform is like a complete diagnostic report for an athletic "engine," showing the specific neuromuscular strategies behind every explosive movement.
For decades, this technology was a cornerstone of sports science research, valued for its incredible precision in quantifying performance. Now, it has transitioned from university labs into the daily routines of professional teams and top-tier physiotherapy clinics around the world.
Decoding the Athlete's Performance Fingerprint
The true value of a force platform lies in its ability to record ground reaction forces thousands of times per second. This stream of data creates what is known as a force-time curve—a unique signature of the jump itself. Think of it as an athlete’s performance fingerprint. It doesn’t just show the result (jump height); it tells the whole story of how they achieved it.
This detailed picture allows coaches and clinicians to move from subjective observation to objective measurement. Instead of guesswork, they can pinpoint exact strengths and weaknesses in how an athlete generates power. This data-driven approach is a game-changer for:
- Optimizing Training Programs: By revealing whether an athlete needs more raw strength, a faster rate of force development, or better use of elastic energy, training becomes highly focused.
- Monitoring Fatigue and Readiness: Subtle changes in an athlete's force-time curve can indicate neuromuscular fatigue before performance visibly declines, helping to prevent overtraining (2).
- Guiding Return-to-Play Decisions: After an injury, force platform data provides objective milestones. This ensures an athlete has fully recovered the strength and power their sport demands before returning to competition.
By analyzing how an athlete interacts with the ground, we gain a direct window into their neuromuscular system. It allows us to see the qualities that separate good athletes from great ones—qualities that are invisible to the naked eye.
More Than Just a Jump Test
The insights gained from a single force platform vertical jump inform a wide range of decisions that drive long-term athletic development. It’s not just about the jump itself. Coaches and therapists are always seeking better ways to support their athletes, from performance to recovery. This is why resources like a comprehensive Best Recovery Tools for Athletes Ultimate Guide are so valuable.
The wealth of information from a simple jump test, which we explore in our guide to force plate testing, establishes a clear baseline for an athlete's physical capabilities. It is an indispensable tool for anyone serious about performance.
References
- Markovic G, Dizdar D, Jukic I, Cardinale M. Reliability and factorial validity of squat and countermovement jump tests. J Strength Cond Res. 2004;18(3):551-555.
- Claudino JG, Cronin J, Mezêncio B, et al. The countermovement jump to monitor neuromuscular status: A meta-analysis. J Sci Med Sport. 2017;20(4):397-402.
Decoding the Force-Time Curve of a Jump
At the core of every vertical jump analysis is a single, surprisingly elegant line of data: the force-time curve. You can think of it like an electrocardiogram (ECG) for athletic power. Just as an ECG traces the heart's electrical activity, the force-time curve maps out the entire story of a jump, moment by moment, in incredible detail.
This "performance fingerprint" is captured by highly sensitive sensors inside the platform. They measure the vertical ground reaction force (vGRF)—the upward push from the ground—at an astonishing rate, often 1,000 times per second (1). This rapid sampling catches every subtle shift in force, from the quiet stillness before the jump to the powerful explosion into the air. We get to see the entire process unfold, not just the final result.
The Story of a Jump, Phase by Phase
Reading a force-time curve is like reading a short, explosive story with a clear beginning, middle, and end. Each part reveals something different about an athlete's neuromuscular strategy and physical capacity. Let's walk through the key moments of a classic countermovement jump (CMJ).
-
Quiet Standing (The Weighing Phase): The story begins with the athlete standing perfectly still on the platform. The force registered here is simply their body weight. This is a critical first step, as it provides the baseline against which all other forces are compared.
-
Unweighting (The Dip): Next, the athlete initiates the jump by rapidly dropping into a squat. This downward acceleration causes the force on the platform to dip briefly below their body weight. A quick, sharp dip in the curve suggests an aggressive start to the movement—the athlete is loading their muscles and tendons like a spring, preparing for release.
-
Braking and Propulsion (The Push-Off): This is the climax of the story. As the athlete stops their downward movement (the braking or eccentric phase) and immediately reverses it into an upward explosion (the propulsive or concentric phase), the force on the platform spikes. The steepness of this upward slope is incredibly revealing, showing how quickly they can generate force.
It's a common misconception that peak force is the most important number. However, sporting actions occur in fractions of a second. How fast an athlete can produce that force is often far more critical for on-field performance.
From Braking to Flight
The braking phase is about absorbing energy, like compressing a coil. The propulsive phase is the powerful release of that stored energy, combined with a massive muscular contraction, to launch the athlete skyward. The shape, peak, and duration of this part of the curve tell us a great deal about their strength and power. To delve deeper into this, check out our dedicated article on the crucial metric known as the rate of force development.
Finally, the force on the platform drops to zero. This is takeoff—the athlete is airborne. The duration of this "zero force" period is the flight time, one of the primary methods for calculating jump height. The story concludes when the athlete lands, creating another large force spike as their body decelerates back onto the platform.
By breaking down the jump into these distinct phases, we can move beyond simply looking at the outcome. We can analyze the specific strategies and physical qualities that create that performance, turning a simple line on a graph into a source of actionable insights.
References
- Owen NJ, Watkins J, Kilduff LP, Bevan HR, Bennett MA. Development of a criterion method to determine peak mechanical power output in a countermovement jump. J Strength Cond Res. 2014;28(6):1552-1558.
How Jump Height Is Accurately Calculated
When an athlete jumps on a force platform, the final height might seem like just one number. But the real value is in how that number is calculated. The technology’s incredible precision—what makes it the gold standard in performance testing—comes from its ability to calculate jump height using multiple, physics-based methods that cross-validate each other.
This isn’t just about running different formulas; it's about analyzing the jump from multiple angles. It’s like having three expert witnesses describe the same event. When all their stories align, you can have confidence in the result. That’s the kind of certainty a force platform provides.
The Flight Time Method
The most straightforward way to determine jump height is the Flight Time method. As the name implies, it is based entirely on how long the athlete is in the air.
The force platform pinpoints the exact millisecond of takeoff (when force drops to zero) and the exact moment of landing (when force reappears). With that precise flight duration, a simple physics equation based on projectile motion yields the peak height. It’s clean, direct, and highly effective.
The Impulse-Momentum Method
For a deeper analysis, there's the Impulse-Momentum method. This approach closely examines the force-time curve to determine the athlete's exact velocity the moment their feet leave the ground.
Impulse is the total force applied over a period of time. By analyzing the propulsive phase—that explosive push against the platform—we can calculate the total impulse generated. The impulse-momentum theorem states that this value is directly related to the athlete's change in momentum. From there, we can find their takeoff velocity and, subsequently, their jump height.
The infographic below breaks down the key phases that feed into these calculations.
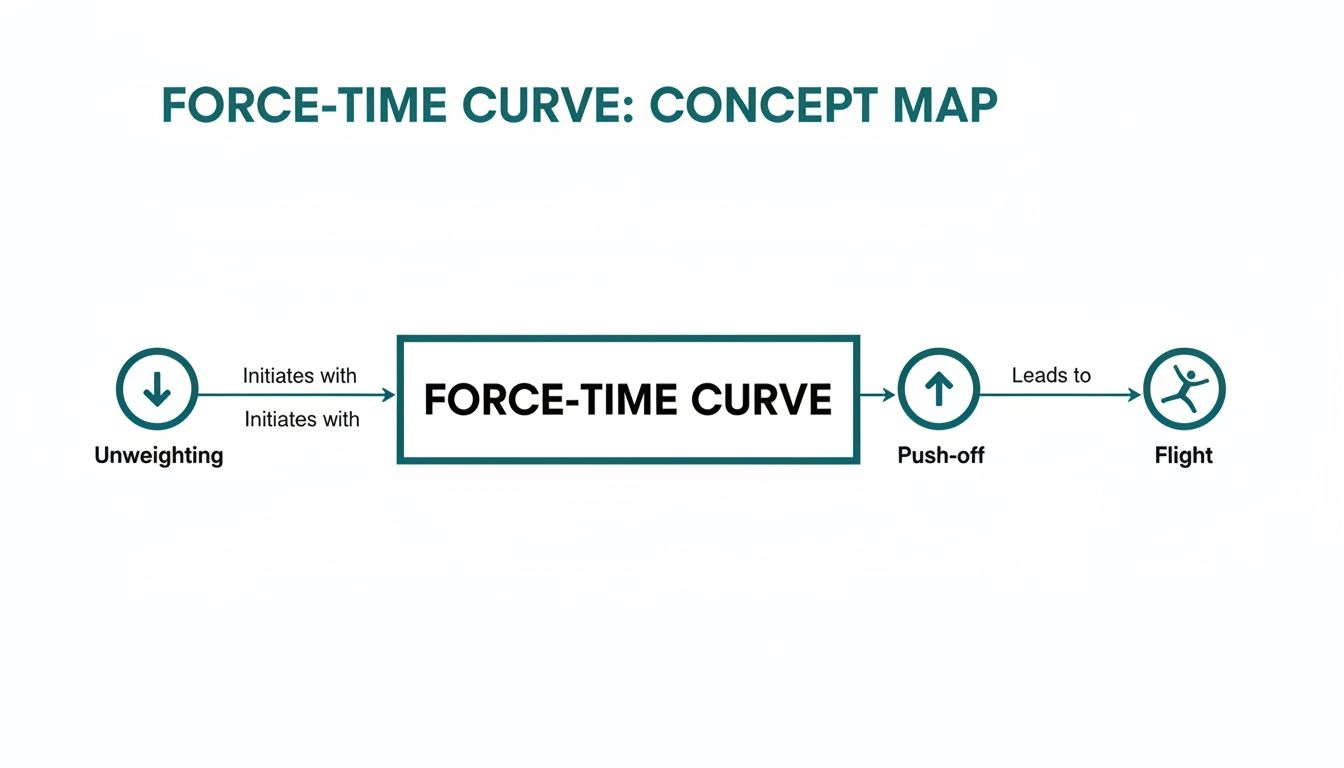
This entire sequence—unweighting, push-off, and flight—is what creates the distinct force-time curve that makes such a detailed analysis possible.
The Work-Energy Method
Finally, the Work-Energy method examines the jump through the lens of energy. In physics, mechanical work is the energy required for a force to move an object. As an athlete pushes off the ground, they are performing work on their own body, increasing its kinetic energy.
This method calculates all the positive work the athlete does during that upward push. By the time they reach the peak of their jump, all that kinetic energy has been converted into potential energy. By measuring the initial work, we can determine the maximum potential energy and obtain a highly accurate jump height. If you want to go deeper into how to measure jump height using these principles, our detailed guide can help.
The real value is this: a properly executed jump will yield nearly identical results from all three methods—flight-time, impulse-momentum, and work-energy. This built-in validation is precisely why force platforms are the undisputed benchmark for measuring vertical jump in scientific and clinical settings.
This multi-layered approach provides a level of certainty that few other tools can match.
Uncovering Key Metrics Beyond Jump Height

While jump height is a useful starting point, it only tells you the final result. The most valuable information is found within the force-time curve data from a force platform vertical jump test. These key metrics reveal how an athlete generates power, providing a detailed blueprint for targeted training and rehabilitation.
Looking past the final number allows coaches and therapists to build a complete athlete profile. We can pinpoint neuromuscular strengths, identify subtle weaknesses, and track changes over time with incredible accuracy. This is where we move from just measuring performance to truly understanding it.
Below is a breakdown of the essential metrics you can obtain from a force platform test, what they mean, and why they are so crucial for shaping an athlete's development.
Essential Vertical Jump Metrics and Their Meanings
| Metric | What It Measures | Why It Matters |
|---|---|---|
| Peak Concentric Force | The maximum upward force an athlete generates during the push-off phase. | A direct indicator of maximal strength. Essential for athletes who need to overcome inertia, like a rugby forward or a shot putter. |
| Rate of Force Development (RFD) | How quickly an athlete can produce force. | Measures explosiveness. Crucial for sports where actions happen in milliseconds, like sprinting or a basketball block. |
| Reactive Strength Index (RSI) | The efficiency of the stretch-shortening cycle (the "rebound effect" of muscles and tendons). | Shows how well an athlete absorbs and reuses elastic energy. Key for activities involving quick changes of direction and repeated jumps. |
Let’s dig a bit deeper into what each of these tells us.
Peak Concentric Force
Peak Concentric Force is the highest amount of upward force an athlete drives into the platform. In simple terms, it's a direct look at their maximal strength during that explosive push-off. Think of it as the raw horsepower of their muscular "engine."
A high peak concentric force indicates a strong athlete who can generate a great deal of force. This is vital in sports where one must move a large mass quickly—whether it's one's own body or an opponent. However, strength is only one piece of the puzzle. An athlete can be incredibly strong but apply that force too slowly to be effective in a fast-paced game.
Rate of Force Development
This brings us to the Rate of Force Development (RFD), arguably one of the most important metrics for athletic success. RFD measures how fast an athlete can generate force. It’s the difference between a slow, grinding lift and an explosive, powerful one. Most actions in sports do not allow time for a slow buildup of force. A sprinter exploding from the blocks or a volleyball player going for a spike relies on hitting peak force in the blink of an eye.
A high RFD is often a distinguishing factor between good and great athletes. It reflects an ability to activate strength instantly—a true mark of explosiveness and neuromuscular efficiency.
Analyzing RFD helps us decide if an athlete needs to focus on building maximal strength or if they would benefit more from plyometrics and speed work to improve how fast they can use the strength they already possess.
Reactive Strength Index
The Reactive Strength Index (RSI) is a brilliant metric for assessing how well an athlete uses the stretch-shortening cycle (SSC). The SSC is that "rebound effect" seen when muscles and tendons are stretched quickly (like in the dip before a jump) and then immediately contract, releasing stored elastic energy.
RSI is typically calculated by dividing the jump height by the ground contact time. A high RSI score suggests an athlete is incredibly efficient at absorbing and redirecting force, essentially getting a "free" power boost from elastic energy. This is a game-changer for sports that demand quick, repeated jumps or rapid changes of direction. A related concept can be explored in our article on the Dynamic Strength Index.
Peer-reviewed research consistently shows that these force-time metrics can distinguish between different levels of athletes (1). To ensure data is reliable, standard clinical protocols often involve three maximal trials, with data sampled at 1,000 Hz to reduce measurement noise and improve the accuracy of derived metrics. You can discover more about these applied research findings.
By looking at this full suite of metrics, practitioners can create a detailed performance fingerprint. This leads to smarter, more individualized training programs that get right to the heart of what each athlete needs to improve.
References
- Stone MH, Sands WA, Carlock J, et al. The importance of isometric maximum and explosive strength in sprint performance. J Sports Sci. 2004;22(2):197-201.
Standardizing Your Testing for Reliable Data

A high-performance force platform provides incredibly precise data, but those numbers are only as good as your testing protocol. If the process is not consistent, it is difficult to determine if a change in metrics is a real physiological adaptation or simply a variation in how the test was conducted. For trustworthy insights, creating a repeatable process is non-negotiable.
The core principle is simple: minimize variables. Everything from the ambient temperature to the verbal instructions can influence an athlete's performance. Elite sports science programs and clinical research settings adhere to rigid protocols because they know that even tiny inconsistencies create "noise" in the data, making it almost impossible to spot meaningful trends (1). This meticulous approach ensures that when you compare an athlete's force platform vertical jump from one week to the next, you are genuinely comparing like with like.
Building a Rock-Solid Testing Protocol
To obtain data that is clean, reliable, and comparable over time, a standardized protocol is essential. The entire goal is to control every possible variable so that the only thing changing is the athlete's actual neuromuscular performance.
Here are the key areas your protocol must address:
- Athlete Familiarization: Never test an athlete without preparation. If they are new to the equipment or the specific jump, a proper warm-up and a few practice trials are essential. Unfamiliarity can lead to hesitant movements that do not reflect their true capabilities.
- Consistent Warm-Up: The warm-up primes the neuromuscular system for an explosive effort. Whether it's a series of dynamic stretches or specific activation drills, it must be identical before every testing session to ensure the athlete is always in a similar state of readiness.
- Clear, Simple Instructions: How you cue the jump dramatically impacts the result. For a Countermovement Jump (CMJ), a simple and consistent instruction like, "Jump as fast and as high as possible," is recommended. Changing the cue can change the athlete's strategy, which will skew the data.
Identifying and Eliminating Common Errors
Even with a strong protocol, small mistakes can compromise your data. Advanced technology cannot fix sloppy execution. Vigilance regarding these common errors is necessary to collect valid force-time data.
The method of data collection is every bit as important as its interpretation. Accurate interpretation is impossible without clean data. Inconsistent procedures mean you are measuring noise, not genuine changes in performance.
One of the most frequent errors is an inconsistent starting depth in a CMJ. A deeper countermovement might generate more power, but it also takes longer, which can affect metrics like Rate of Force Development.
Another classic mistake is allowing a varied arm swing when the protocol calls for hands on hips (or vice versa). This introduces a significant variable that can artificially inflate or deflate jump height and power metrics (2).
Finally, always conduct multiple trials. The standard is typically three maximal-effort jumps. You can then use the average or the single best score. This simple step helps account for slight variations in effort and ensures the data reflects the athlete's stable, repeatable performance—not just a one-off attempt.
By standardizing these elements, you transform a simple measurement into a powerful diagnostic tool.
References
- Nuzzo JL, Anning JH, Scharfenberg JM. The reliability of the countermovement jump, squat jump, and reactive strength index calculated from force plate data. J Sport Rehabil. 2011;20(4):488-498.
- Lees A, Vanrenterghem J, De Clercq D. The maximal and submaximal vertical jump: implications for strength and conditioning. J Strength Cond Res. 2004;18(4):787-791.
Comparing Jump Measurement Technologies
With many ways to measure a vertical jump available today—from smartphone apps to complex motion capture systems—it is important to understand why force platforms remain the undisputed gold standard in scientific and high-performance settings.
The answer lies in one fundamental difference: measuring an outcome versus understanding its cause.
Most tools, like jump mats or laser timers, are reasonably good at estimating one thing: jump height. They typically calculate it by measuring flight time—how long an athlete is in the air. While that final number is useful, it provides no information about how or why the jump happened. It's like knowing the final score of a game without having seen a single play.
The Power of Direct Measurement
A force platform vertical jump test is fundamentally different. It measures kinetics—the actual forces that create movement. It doesn’t estimate or infer; it directly records the ground reaction forces an athlete generates to push off the ground. This direct measurement unlocks a level of analysis that other tools cannot provide.
Imagine a mechanic trying to diagnose an engine problem just by listening to it. They might get a rough idea, but a real diagnosis involves plugging into the car's computer to read direct data from its sensors. Force platforms are that diagnostic tool for human movement.
While many devices can tell you that an athlete jumped high, only a force platform can tell you precisely how they generated the force to do so. This distinction is critical for making informed decisions in high-stakes performance and clinical environments.
Why Different Technologies Yield Different Results
This is not just a technical detail; the measurement method has real-world consequences. Peer-reviewed research has shown that different methods, such as motion capture (which tracks movement, or kinematics) and force platforms (which measure force, or kinetics), can produce significantly different results for the same metrics. For instance, crucial metrics like Peak Power and Rate of Force Development (RFD) can vary substantially depending on whether they are calculated from a direct force-time curve or inferred from motion tracking.
This is why elite sports science labs and professional teams almost universally rely on direct force measurement. They often use high sampling rates of 1,000 Hz to capture every detail, ensuring the most consistent and reliable data for athlete monitoring.
Understanding the evolving landscape of technology in gyms helps place the value of this kind of advanced equipment into context. For any practitioner making critical decisions on training loads, managing fatigue, or clearing an athlete for return-to-play, the accuracy and depth from direct force measurement are indispensable. While other tools have their place, for those serious about understanding athletic power, force platforms remain the scientific benchmark.
Vertical Jump Testing FAQs
Even after understanding the technology, practical questions often arise when implementing force platforms for vertical jump testing. Here are a few of the most common ones from physiotherapists, rehabilitation specialists, and performance coaches. Addressing these details is key to ensuring your testing is both accurate and genuinely useful.
This section aims to bridge the gap between the science of force analysis and its practical application with athletes.
What's the Difference Between a Countermovement and Squat Jump?
While both are vertical jumps, these two tests reveal very different things about an athlete's neuromuscular system.
A Countermovement Jump (CMJ) involves the athlete starting tall, dipping down quickly, and then immediately exploding upward. That quick dip utilizes the stretch-shortening cycle—storing and then releasing elastic energy, much like stretching a rubber band. This action typically leads to a more powerful jump (1). The CMJ is an excellent measure of an athlete's explosive ability.
In contrast, a Squat Jump (SJ) removes the influence of the stretch-shortening cycle. The athlete starts in a static squat position, holds it briefly, and then jumps. This isolates pure concentric strength, showing how much force they can produce without the aid of stored elastic energy. Comparing the two jump types can reveal how effectively an athlete uses that elastic energy.
How Do Dual Force Platforms Measure Asymmetry?
Using a separate force plate under each foot is a game-changer for identifying neuromuscular imbalances. A dual force platform setup is the gold standard for this purpose because it measures the force from the left and right legs independently throughout the entire jump.
We can then compare key metrics like peak force or impulse from each leg to pinpoint any asymmetries.
A significant difference between limbs, often cited in research as a potential concern when over 10-15%, can be a noteworthy finding (2). It may signal a need for further assessment or suggest an area to target in a training or rehabilitation plan.
This granular data allows for highly precise interventions to help an athlete achieve better balance.
Can This Technology Be Used Outside a Lab?
Absolutely. Not long ago, force platforms were bulky, expensive pieces of equipment confined to university research labs. Today's systems are built for real-world application—they are portable, durable, and designed for practitioners in the field.
You will find professional teams, performance clinics, and physiotherapy practices using them directly on the court, field, or in the clinic. Taking testing out of the lab and into the athlete's actual environment can provide data that is more relevant to their sport. With intuitive software, this powerful analysis is no longer just for academics; it's accessible to a wider range of professionals.
Ready to stop guessing and start measuring? The Meloq EasyBase force plate brings lab-grade accuracy to a portable, user-friendly system built for the realities of clinical and field settings.
Explore how EasyBase can elevate your practice at Meloq
References
- Komi PV. Stretch-shortening cycle: a powerful model to study normal and fatigued muscle. J Biomech. 2000;33(10):1197-1206.
- Bishop C, Turner A, Read P. Effects of inter-limb asymmetries on physical and sports performance: a systematic review. J Sports Sci. 2018;36(10):1135-1144.

Featured Product
EasyBase Force Plates
Portable dual force plate system for jump testing, balance & rehab. No subscription fees.
Learn More