
A Practitioner's Guide to Force Plate Vertical Jump Testing
Team Meloq
Author
Measuring a force plate vertical jump offers far more than just how high an athlete can get off the ground. It provides a direct, unfiltered look into the performance of their neuromuscular system. For sports scientists, physiotherapists, and rehabilitation specialists, this assessment has become an indispensable tool for quantifying explosive power, tracking fatigue, and gauging recovery with scientific precision.
Why the Vertical Jump Tells a Deeper Story
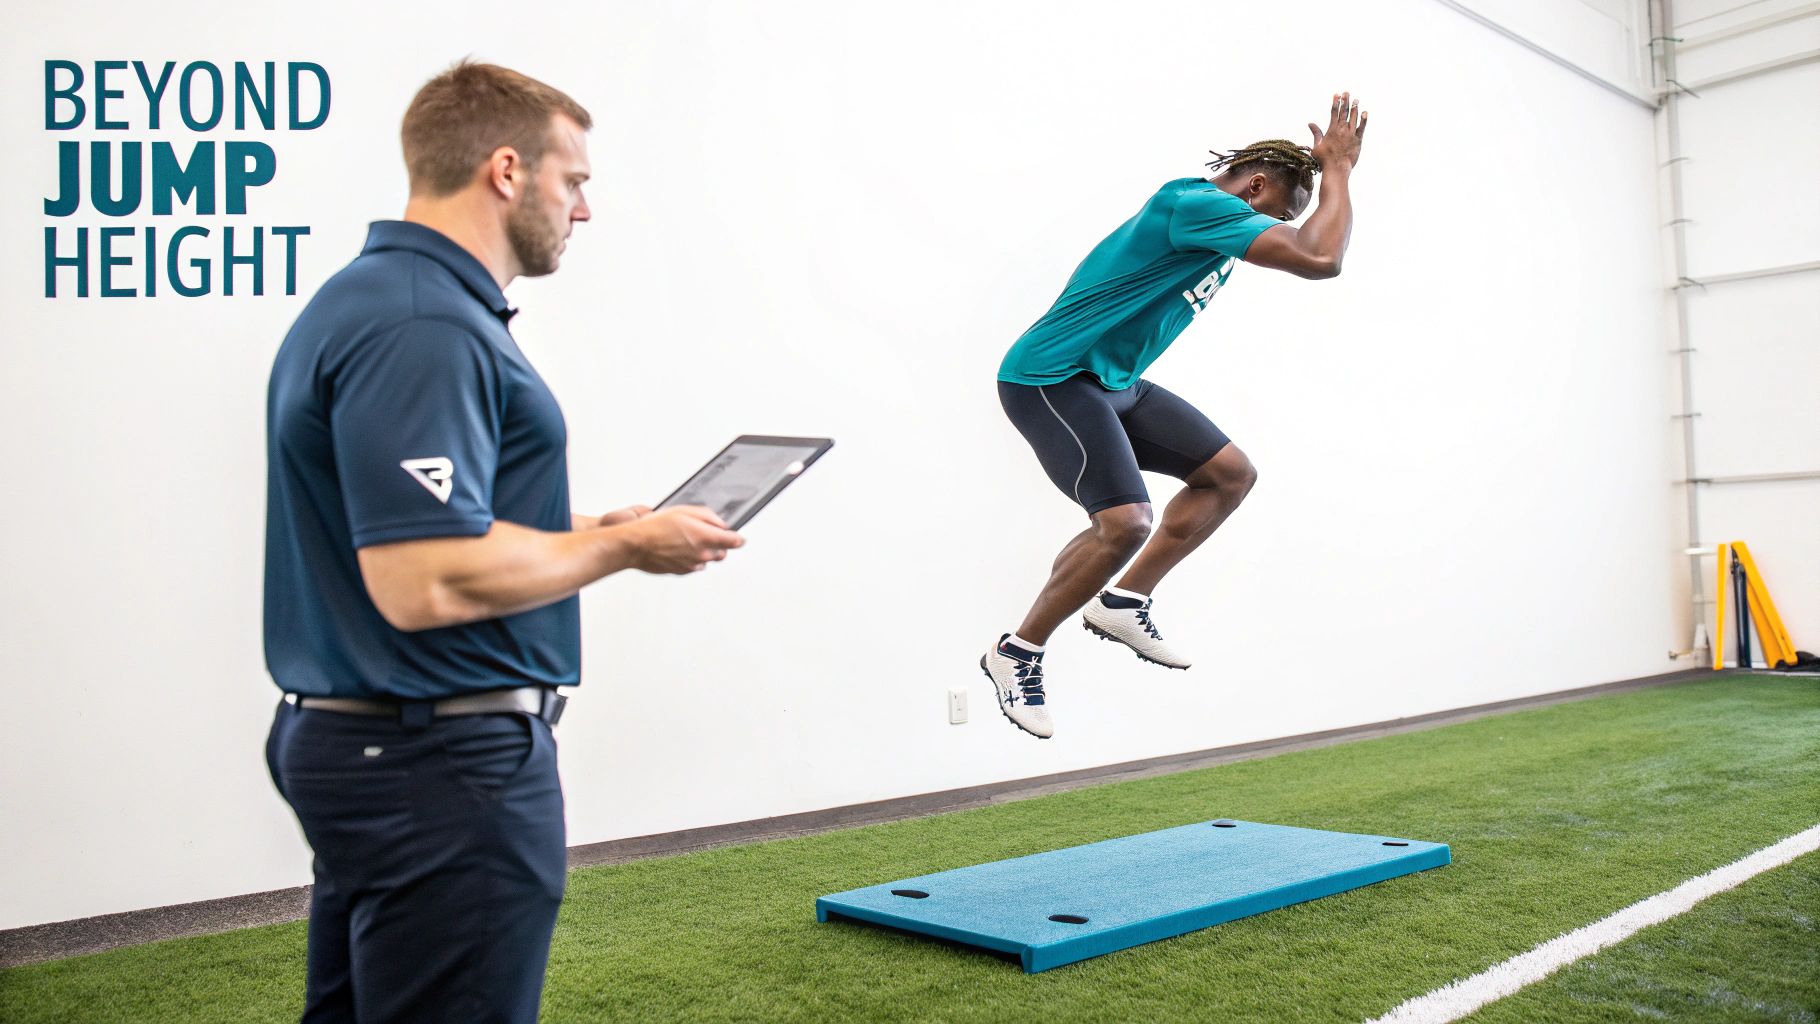
Simply clocking the peak height of a jump barely scratches the surface of an athlete's capability. The real value of using a force plate is its ability to capture the entire story of the jump from start to finish. This single test uncovers the hidden mechanics behind the movement—elements that are completely invisible to the naked eye.
At its core, the test measures ground reaction force, which is the force the ground exerts back on the body. As an athlete jumps, the force plate records exactly how they apply force to propel themselves upward, creating a unique force-time signature for every individual. If you want to dive deeper into the physics behind this, check out our guide on what is force measurement.
Beyond Jump Height
Jump height is a useful outcome metric, but the process of achieving that height contains the richest information. The force-time curve derived from a vertical jump test can reveal crucial insights.
- Neuromuscular Fatigue: Subtle changes in how an athlete produces force can signal fatigue long before their performance overtly drops. This allows practitioners to be proactive, adjusting training loads to prevent overtraining and potentially lower injury risk (1).
- Movement Strategy: The shape of the curve tells us how an athlete generates power. Are they using a rapid, elastic "bounce," or are they relying more on muscular strength? This insight helps tailor training programs to an individual's specific needs.
- Return-to-Play Readiness: After an injury, comparing an athlete's current force signature to their pre-injury baseline provides objective data. This helps in making more confident return-to-play decisions, ensuring they have not only regained strength but also their ability to produce force quickly and efficiently.
The data from force plate assessments are one component in understanding an athlete's "readiness." Other factors like sleep, nutrition, and psychological state must also be considered, but force data provides a direct window into the neuromuscular system.
Understanding these underlying metrics is what transforms the vertical jump from a simple power test into a powerful diagnostic tool. The rest of this guide will walk you through how to capture this rich data and turn it into actionable insights for your athletes.
Setting the Stage for Reliable Data
Inaccurate data can be worse than no data at all. The reliability of a force plate vertical jump test can be determined before an athlete even steps on the plate, based on how well the environment is controlled. To obtain accurate, repeatable measurements, it is essential to establish a robust testing procedure that minimizes variables that can contaminate the data.
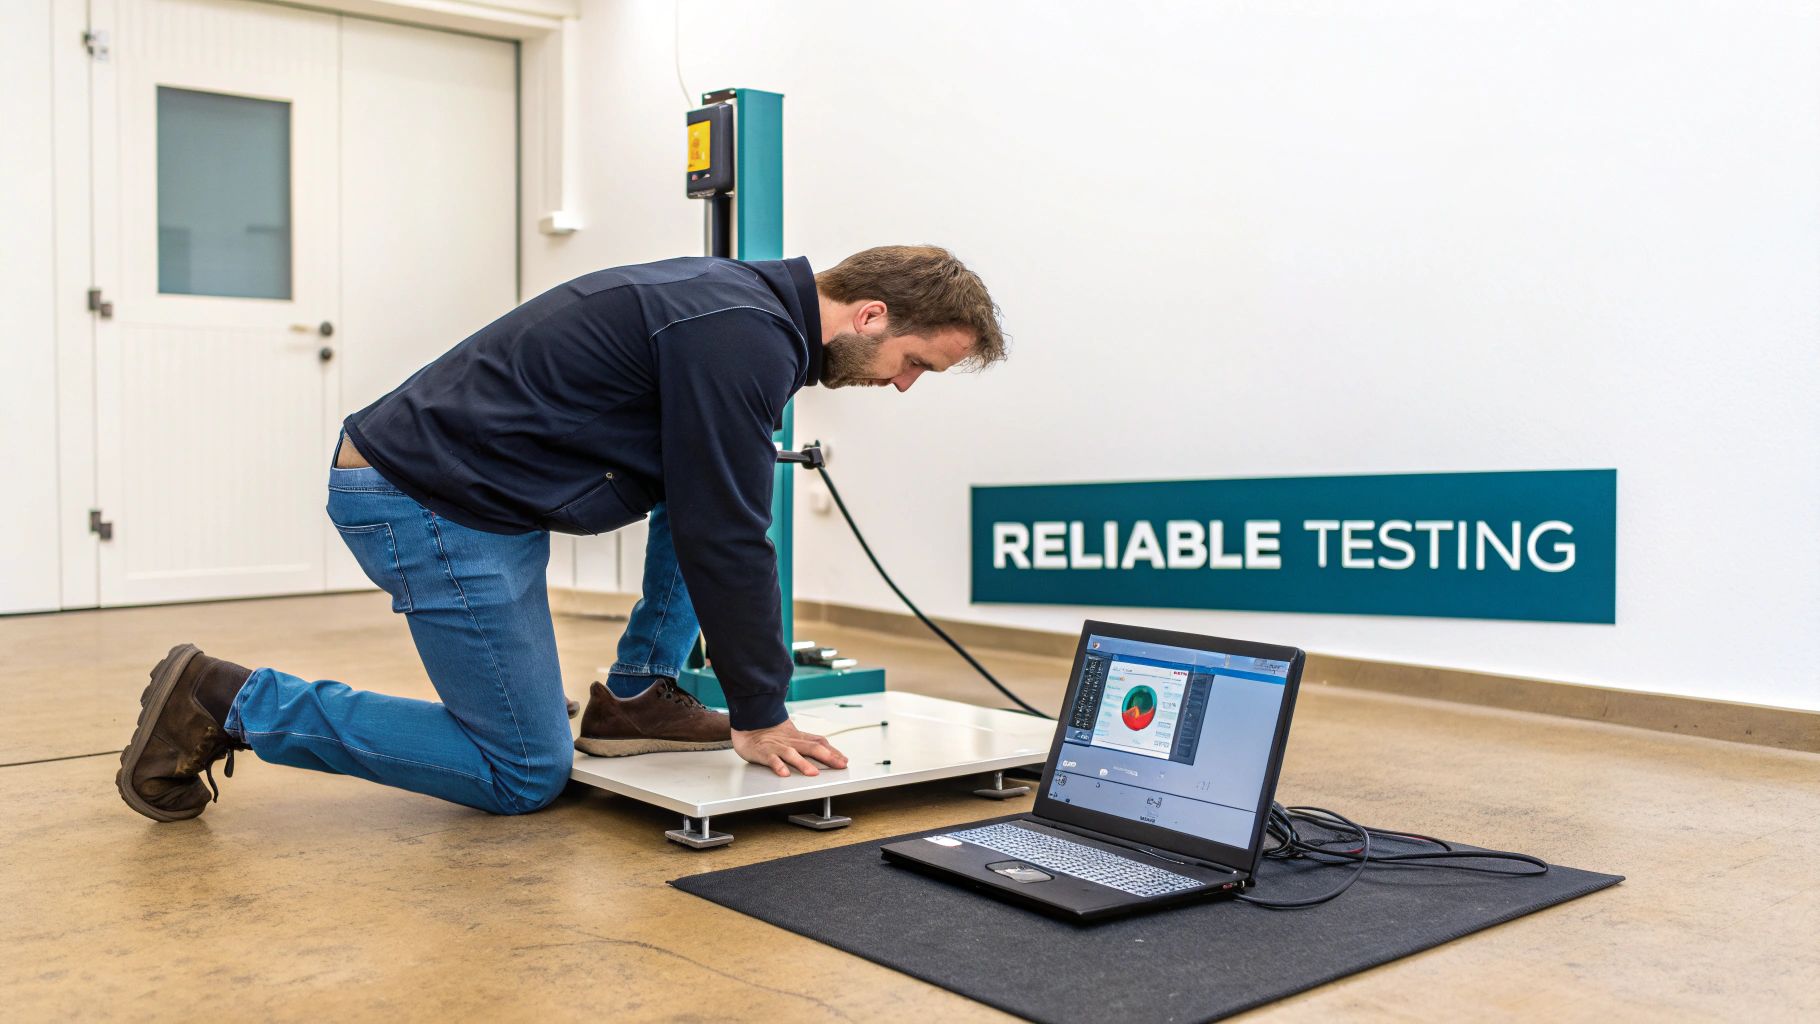
The process begins with the hardware. The force plate must be on a completely level and stable surface. Any tilt or wobble, no matter how small, will affect the force readings. Using a spirit level is a non-negotiable step.
Once level, the system must be zeroed. This critical calibration sets the sensors' baseline to zero force, ensuring that the measurement reflects only the athlete's output. It is good practice to perform this before every testing session and any time the plates are moved.
Prepping the Athlete for a Max-Effort Jump
With the equipment calibrated, the focus shifts to the individual. An athlete's preparation is as crucial as the technology being used. Comparing a jump performed "cold" to one after a proper warm-up is invalid, as the results will be significantly different.
A standardized warm-up is the only way to ensure consistency. It does not need to be elaborate, but it must be consistent for every testing session. The goal is to prime the neuromuscular system for a maximal jump.
A typical warm-up protocol might include:
- General Movement: 5-10 minutes of light cardio, such as using an exercise bike or jogging, to increase core temperature.
- Dynamic Stretching: Movements like leg swings, hip circles, and walking lunges to enhance mobility in key joints.
- Activation Drills: Exercises like glute bridges and light pogos to engage key muscle groups.
- Submaximal Jumps: A few practice jumps at approximately 50% and then 75% effort to acclimatize the body to the explosive movement pattern.
Following a structured routine ensures the athlete is in a similar physiological state for every test, enabling the tracking of genuine performance changes rather than day-to-day fluctuations in readiness (2).
Reliable data collection is as important as the subsequent interpretation. Accurate insights cannot be derived from inconsistent or flawed data.
Standardizing Your Instructions and Cues
The final piece of the setup is ensuring instructions are identical every time. The cues provided to an athlete can significantly alter their movement strategy, and these changes will be clearly visible on the force-time curve. For example, the instruction "jump as high as you can" may elicit a different result than "jump as high and as fast as you can" (2).
For a countermovement jump (CMJ) with an arm swing, a simple and clear script is recommended.
Example Script:
"Stand still in the middle of the plates with your feet about shoulder-width apart. When I give the cue, I want you to dip down and then explode up, jumping as high and as fast as you possibly can. Use your arms to help power the jump. Land back on the plates and hold your landing for a moment."
This script covers the key points: a still starting position, maximal intent ("high and fast"), the use of an arm swing, and a stable landing. By repeating these exact cues for every jump, practitioners can be more confident that changes in the data originate from the athlete, not from variations in instruction.
To learn more about the application of this technology, you can explore how force platforms are used in biomechanics in our related article.
Conducting the Test: From Cues to Capture
With the force plate stable and the athlete prepared, it's time to conduct the test. The standard protocol in many performance and clinical settings is the Countermovement Jump (CMJ). It is valued for providing a clear window into how an athlete utilizes the stretch-shortening cycle—a critical component of explosive movement. The objective is to elicit a genuine, maximal effort from the athlete while the force plate captures every detail.
The words used are more than just instructions; they are powerful tools. Minor changes in verbal cues can alter an athlete's movement strategy, affecting everything from jump height to the rate of force development.
For the CMJ, simplicity and consistency are paramount.
A recommended instruction, repeated verbatim for every trial, is: "Stand still and wait for my cue... Jump as high and as fast as you can."
This specific phrasing is intentional. It encourages the athlete to maximize both height (an output metric) and speed (a rate-dependent metric). Research suggests that cueing for height alone versus speed alone can produce different force-time curves. To obtain a comprehensive picture of an athlete's capabilities, it is often beneficial to cue for both (3).
The Four Phases of a Countermovement Jump
From the moment an athlete begins to move until they land, the force plate records a narrative of the jump. This story is broken down into four distinct biomechanical phases, each providing a unique piece of the performance puzzle. Understanding these phases is the first step to interpreting the data.
- Unweighting Phase: This is the initial downward movement or "dip." The athlete accelerates their center of mass downward, causing the force reading on the plate to drop below their body weight. A rapid, deep unweighting phase can set up a powerful jump by increasing the range of motion to build momentum.
- Braking Phase (Eccentric): At the bottom of the dip, the athlete must decelerate their downward momentum. This is observed as a large spike in force on the graph—often the highest peak of the entire curve—as they absorb and redirect energy.
- Propulsive Phase (Concentric): This is the upward explosion. Immediately after the braking phase, the athlete reverses direction and drives into the ground to propel themselves upward. The effectiveness of this phase depends heavily on how efficiently they utilize the elastic energy stored during the braking phase.
- Flight Phase: This is the period when the athlete is airborne, and the force on the plate drops to zero. The duration of this "flight time" is a key variable used to calculate jump height.
Best Practices for Data Collection
Conducting a valid test involves more than reciting cues and knowing the phases. It requires managing the entire session to control for variables and ensure the data is robust.
Number of Trials and Rest Periods
A single jump rarely represents an athlete's true potential. Multiple repetitions are needed to identify a maximal effort.
- Aim for 3-5 maximal effort jumps. This provides enough data to identify a true peak effort without inducing significant fatigue. The first jump is often considered a familiarization trial and may be discarded from analysis.
- Provide 45-60 seconds of rest between jumps. This is important. It allows for partial recovery of the phosphocreatine energy system, which is crucial for ensuring each attempt is a true maximal effort and not influenced by fatigue from the previous jump (3).
You can explore the nuances of jump testing in our article on different methods for vertical leap measurement.
Identifying an Invalid Trial
Before analyzing the force-time curve, a flawed attempt can often be identified visually. Recognizing common mistakes can save time and prevent the analysis of erroneous data.
- Excessive pre-jump movement: The athlete must be perfectly still before starting. Any rocking or swaying adds noise to the data and complicates the identification of the true start of the unweighting phase.
- Landing off the plate: If any part of the foot misses the force plate on landing, the trial is invalid.
- Tucking the knees in the air: This action artificially extends flight time, which inflates the jump height calculation and renders the data inaccurate. The legs should remain relatively extended during flight.
- A pause at the bottom: The countermovement should be a smooth, continuous "V" shape. Any hesitation at the bottom indicates a loss of elastic energy and an inefficient jump.
Making Sense of the Force-Time Curve
At first glance, the raw output from a force plate vertical jump test—the force-time curve—may appear complex. However, this single line contains the entire story of the jump. It allows us to move beyond simply asking how high and begin to understand how an athlete produced that jump, revealing their unique movement strategy.
Deconstructing this graph is the key to unlocking deeper, more actionable insights. Every peak, valley, and slope on that curve corresponds to a specific biomechanical event during the jump. Knowing what to look for allows practitioners to see the individual components that create an explosive performance.
This chart breaks down the distinct phases of a countermovement jump as they appear on the force-time curve.
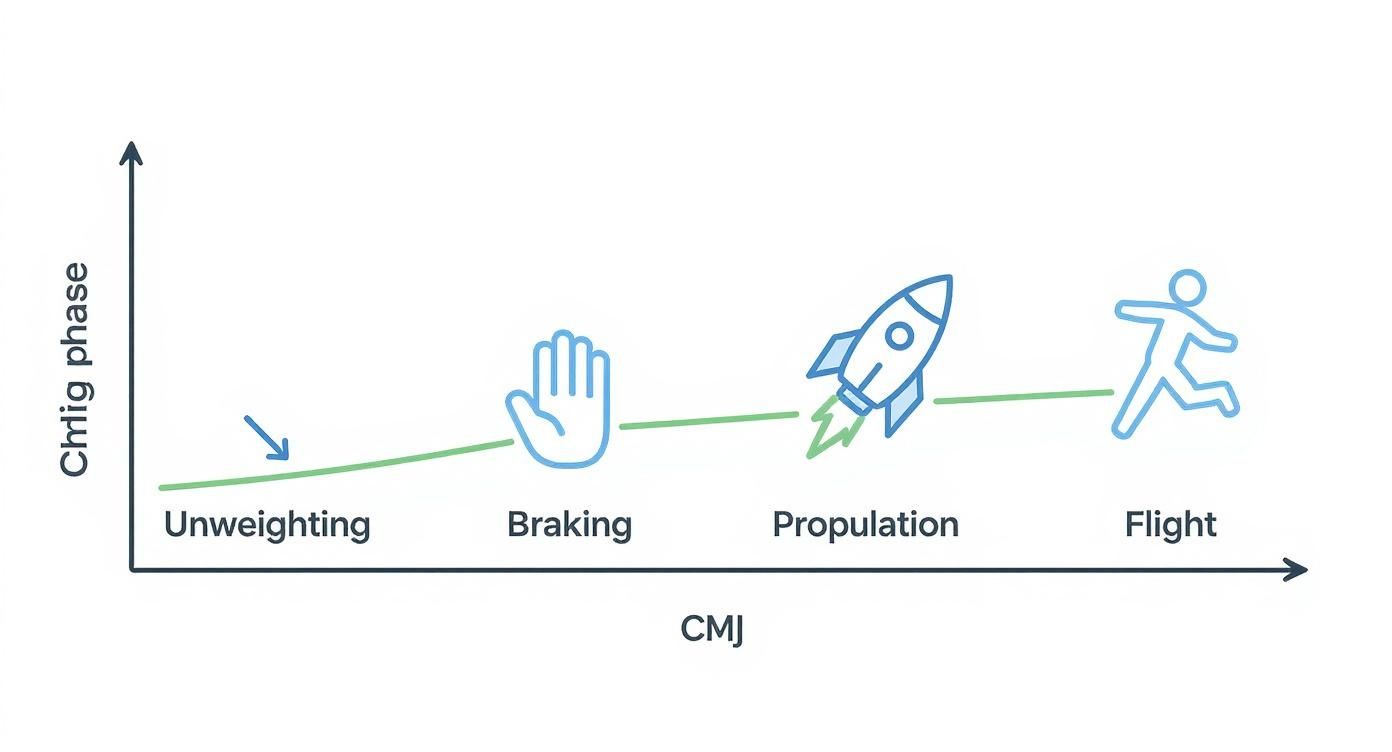
The graph clearly shows how an athlete's force output changes relative to their body weight. It begins with the initial downward 'unweighting,' moves into the powerful braking and propulsive phases, and concludes with the zero-force flight period when they are airborne.
Key Metrics Explained
The force-time curve is rich with data, but a few key metrics convey most of the essential information. These numbers translate the shape of the curve into practical information about an athlete's physical qualities.
- Peak Force: This is the highest point on the curve, typically occurring during the braking phase. It represents the maximum amount of force the athlete can absorb and redirect. An athlete with high peak force has a strong capacity for deceleration—a crucial foundation for explosive movements.
- Impulse: This is the area under the curve during the propulsive (upward) phase, representing the total force applied over that period. Greater impulse leads to a greater change in momentum, resulting in a higher take-off velocity and, consequently, a higher jump.
- Rate of Force Development (RFD): This metric indicates how quickly an athlete can generate force. It is calculated from the slope of the force-time curve at the beginning of the propulsive phase. High RFD is critical in sports where actions occur in fractions of a second. You can explore more about the importance of Rate of Force Development in our dedicated article.
It is important to note that two athletes could achieve the exact same jump height with vastly different force-time curves. One might rely on a massive peak force, while another achieves it with exceptionally rapid RFD. These differences allow for truly individualized training based on an athlete's performance profile.
Two Methods for Calculating Jump Height
While the force-time curve explains how the jump occurred, the ultimate goal is often to determine jump height. Force plates use two primary methods for this calculation, and understanding the difference is crucial for accurate interpretation and comparison.
The two main methods are the Impulse-Momentum method and the Flight Time method. Each is based on different principles and derived from different parts of the force-time curve.
The impulse-momentum method calculates take-off velocity from the net impulse generated during the propulsive phase. The flight time method, in contrast, simply measures the duration the athlete is airborne, from take-off to landing.
Modern force plates capture this kinetic data with high precision. It is not uncommon for portable research-grade plates to measure maximal forces with very high reliability, sampling at frequencies of 500 Hz or higher to ensure every nuance of force application is recorded. You can read a research paper on the reliability of portable force plate systems in sport.
Comparison of Jump Height Calculation Methods
The choice of method depends on the context, the athlete, and the specific measurement goals. This table outlines the core differences.
| Method | Calculation Principle | Advantages | Potential Disadvantages |
|---|---|---|---|
| Impulse-Momentum | Uses the relationship between impulse (force x time) and momentum to calculate velocity at take-off. | It is not affected by landing mechanics, making it robust against athletes who might alter their landing to influence the result. | It can be sensitive to the accurate identification of the start of the jump, requiring a perfectly still starting position. |
| Flight Time | Calculates jump height based solely on the time the athlete is in the air (force = 0 N). | It is a very direct and intuitive measurement of the jump's outcome. | It is highly susceptible to landing strategy. An athlete landing with bent knees will record a shorter flight time than one who lands with stiffer legs. |
In many research and high-performance settings, the impulse-momentum method is considered the gold standard. This is because it reflects the actual propulsive mechanics of the jump itself, independent of the landing strategy.
However, the flight time method is still widely used and can be reliable, provided that the landing technique is standardized and consistent across all trials. The most important principle is to choose one metric and use it consistently when tracking an athlete over time.
Common Mistakes and How to Fix Them
Even with high-quality equipment, obtaining clean data from a force plate vertical jump test is not guaranteed. Small errors in protocol or execution can introduce noise and compromise the validity of the results. Understanding these common pitfalls is the first step toward ensuring every recorded jump is a true measure of an athlete's ability.
These issues typically fall into two categories: athlete-related errors, which stem from how the jump is performed, and equipment-related errors, which are technical issues that interfere with the measurement process. Both can significantly skew data, leading to flawed interpretations and misguided training decisions. Fortunately, most are easily corrected once identified.
Athlete-Related Errors
The most frequent source of error comes directly from the athlete's movement. A subtle rock or sway before initiating the jump is a classic mistake. This "pre-jump noise" makes it difficult for the software to accurately pinpoint the true start of the unweighting phase, which can affect subsequent calculations for metrics like impulse and rate of force development.
Another common issue is landing with excessively bent knees or taking a step upon landing. If using the flight time method to calculate jump height, this is a critical flaw. A deep, cushioned landing shortens the time the athlete is recorded as being in the air, which will artificially deflate their jump height measurement.
- The Fix for Pre-Jump Movement: Emphasize stillness. Instruct the athlete to stand completely still for a full two seconds before giving the jump cue. This provides a clean, stable bodyweight signal before the test begins.
- The Fix for Poor Landings: Cue a "stick and hold" landing. The athlete should land in a stable athletic position and maintain it for a few seconds without additional movement. This standardizes the landing across all trials, improving the reliability of flight time data.
Equipment and Software Gremlins
Beyond the athlete, the setup can also be a source of error. Incorrect or infrequent calibration is a major culprit. Failing to zero the force plate before each testing session means the baseline is not true zero, and every subsequent reading will be inaccurate.
Signal noise is another potential problem. Interference from nearby electronic devices, such as mobile phones or power cables, can introduce small, erratic fluctuations in the force signal. While often minor, this noise can affect sensitive metrics.
It is crucial to remember that different measurement tools can yield different results. Vertical jump height from force plates is typically more precise and often lower than measurements from tools like a Vertec. One study noted that Vertec measurements were, on average, 27% higher than force plate data, largely because the Vertec captures hand reach, not just the displacement of the body's center of mass (4). Learn more about these measurement differences.
Finally, applying an inappropriate data filter in the analysis software can either obscure important details or fail to remove unwanted noise. Most software has default settings, but it is important to understand their function and ensure they are suitable for the rapid movements of a vertical jump. Diligence with these technical checks builds confidence in the collected data.
Turning Jump Data Into Actionable Insights
Collecting numbers from a force plate vertical jump test is only the first step. The real skill lies in translating those metrics into intelligent, practical strategies that can enhance performance and mitigate injury risk. This is where the connection is made between the force-time curve and the real-world decisions made in training or clinical settings.
Transforming this biomechanical data into useful information requires looking beyond a single jump height. Context is key. For example, a drop in jump height is noteworthy, but a drop in jump height combined with a significant increase in the braking phase duration tells a much richer story about potential neuromuscular fatigue.
Monitoring Fatigue and Readiness
One of the most powerful applications of the force plate vertical jump is for monitoring an athlete's readiness to perform. Regular testing can provide an objective window into how an individual is responding to the stresses of training and competition. Small changes can serve as early warning signs.
For example, a basketball player in a demanding competitive period may maintain their jump height, but their Rate of Force Development (RFD) might drop by 15%. This could signal that while they can still produce the necessary force, it is taking them longer to do so—a classic sign of accumulating fatigue. This provides an opportunity to intervene before performance declines, perhaps by adjusting training volume or emphasizing recovery.
Force plates are a cornerstone for monitoring vertical jump performance, a key indicator of lower limb power. A meta-analysis demonstrated that vertical jump height measured by force plates decreases significantly immediately after strenuous exercise, with performance typically returning to baseline after approximately three days of recovery (5).
Guiding Rehabilitation and Return-to-Play
In a rehabilitation setting, force plates offer objective data that cannot be obtained through visual assessment alone. Following a lower limb injury, such as an ACL reconstruction, determining when an athlete is truly ready to return to sport is a significant challenge. Visual checks and manual strength tests are useful but do not capture the dynamic, high-speed force production that sports demand.
Using dual force plates allows for the precise measurement of asymmetries in force production between the injured and uninjured limbs.
- Scenario: An athlete is nine months post-operative from ACL surgery. Their quadriceps strength on the surgical side tests at 95% of the contralateral side, and they appear to run well in a straight line.
- Force Plate Insight: A bilateral CMJ test reveals a 20% asymmetry in peak propulsive force. The data indicates they are still hesitant to load the surgical leg aggressively.
- Actionable Insight: This shows that despite good static strength, the athlete has not fully restored their confidence or ability to produce force quickly and symmetrically. Programming can then be targeted to address this specific deficit with plyometrics and single-leg power exercises before they are cleared for full activity.
Profiling Athletes for Individualized Training
No two athletes are identical, and their force-time curves reflect this. By analyzing the shape of the curve and key metrics, athletes can be profiled based on their dominant movement strategy. This enables the creation of highly individualized training plans.
Generally, athletes can be grouped into two broad profiles:
| Athlete Profile | Dominant Quality | Typical Force-Time Curve | Recommended Training Focus |
|---|---|---|---|
| Force-Dominant | High Peak Force, Slower RFD | Broader curve with a high peak; longer time to take-off. | Speed-strength and plyometrics (e.g., box jumps, loaded squat jumps) to improve the rate at which they can express their strength. |
| Velocity-Dominant | High RFD, Lower Peak Force | Sharp, steep curve with a lower peak; very quick time to take-off. | Maximal strength training (e.g., heavy squats, deadlifts) to increase their overall force-producing capacity. |
This type of profiling moves away from one-size-fits-all programming. By targeting each athlete's specific areas for improvement, training becomes more efficient and effective.
To continually sharpen data interpretation skills, it is essential for practitioners to know how to read scientific papers effectively. This skill is crucial for staying current with the latest research and applying evidence-based methods in practice. Ultimately, the goal is to use the objective feedback from the force plate to guide a smarter, more targeted approach to athlete development.
At Meloq, we believe in empowering professionals with the tools to replace subjective guesswork with objective, actionable data. Our ecosystem, featuring the EasyBase force plate, is designed to provide the clear, reliable insights you need to monitor fatigue, guide rehabilitation, and optimize performance.

Featured Product
EasyBase Force Plates
Portable dual force plate system for jump testing, balance & rehab. No subscription fees.
Learn More