
Force and Velocity Relationship in Muscle Performance
Team Meloq
Author
Ever wonder why you can't lift a heavy weight as fast as a light one? The answer lies in the force and velocity relationship, a fundamental trade-off in muscle physiology that governs nearly every move we make. In short, your muscles can produce tremendous force at very low speeds, but as you try to move faster, the amount of force you can generate decreases. This principle is a cornerstone of athletic performance and rehabilitation.
The Bicycle Analogy for Muscle Performance
Think about riding a bike up a steep hill. You instinctively shift into a low gear. This lets you apply a large amount of force to the pedals, but your feet—and the bike—move slowly. You're operating in a high-force, low-velocity zone.
Now, picture yourself cruising down a long, flat road. You shift into a high gear. Your legs are spinning rapidly, but the force you put into each pedal stroke is relatively small. This is the other end of the spectrum: high-velocity, low-force.
Your muscles operate on this exact same principle. This isn't just an intuitive idea; it's a cornerstone of biomechanics, first described in detail by A.V. Hill in 1938 (1). His foundational research described this relationship with a hyperbolic equation, showing that as a muscle's shortening speed increases, its ability to produce force drops in a predictable curve. This concept remains central to exercise science and sports medicine today.
Why This Relationship Matters
Understanding this trade-off is crucial for anyone involved in human movement, from elite performance coaches to physiotherapists guiding a patient's recovery. It is the very essence of power, which is simply the product of force and velocity.
At any given moment, your muscles must contend with an inverse relationship: the capacity for high force comes at the expense of high velocity, and vice versa. Leveraging this principle is key to unlocking athletic power and designing smarter rehabilitation programs.
This is why a powerlifter completing a one-repetition maximum squat generates incredible force but moves at a very slow speed, while a sprinter’s legs cycle with blinding speed but produce less peak force in each individual stride.
- For Athletes: It allows coaches to identify and target an athlete's specific needs. Is the goal to build the explosive strength for a powerful tackle or the high-speed contraction needed for a perfect golf swing? The training approach for each will be different.
- In Rehabilitation: Therapists use this concept to progress patients safely. Early on, the focus might be on slow, controlled movements (high force, low velocity) to rebuild strength without placing undue stress on healing tissues. As the patient recovers, the program can shift toward faster, more functional movements.
By understanding the basics of how force is calculated and applied, one can start to see these nuances in every physical activity. This is the invisible physics behind every jump, lift, and sprint.
Decoding the Force-Velocity Curve
The relationship between force and velocity is not a simple straight line. Instead, it is represented by a distinct, hyperbolic curve that maps a muscle's capabilities. Think of this curve as a fingerprint of an athlete's performance profile—it has specific landmarks that tell us about how they generate force at different speeds.
Understanding its shape is the first step toward unlocking smarter ways to train and rehabilitate. The curve illustrates a fundamental trade-off: as the external load a muscle works against decreases, the speed at which it can contract increases. This inverse relationship defines the outer limits of our physical output.
This infographic effectively illustrates the two extremes. On one side, a weightlifter represents high-force, low-velocity movements, and on the other, a sprinter showcases high-velocity, low-force actions.
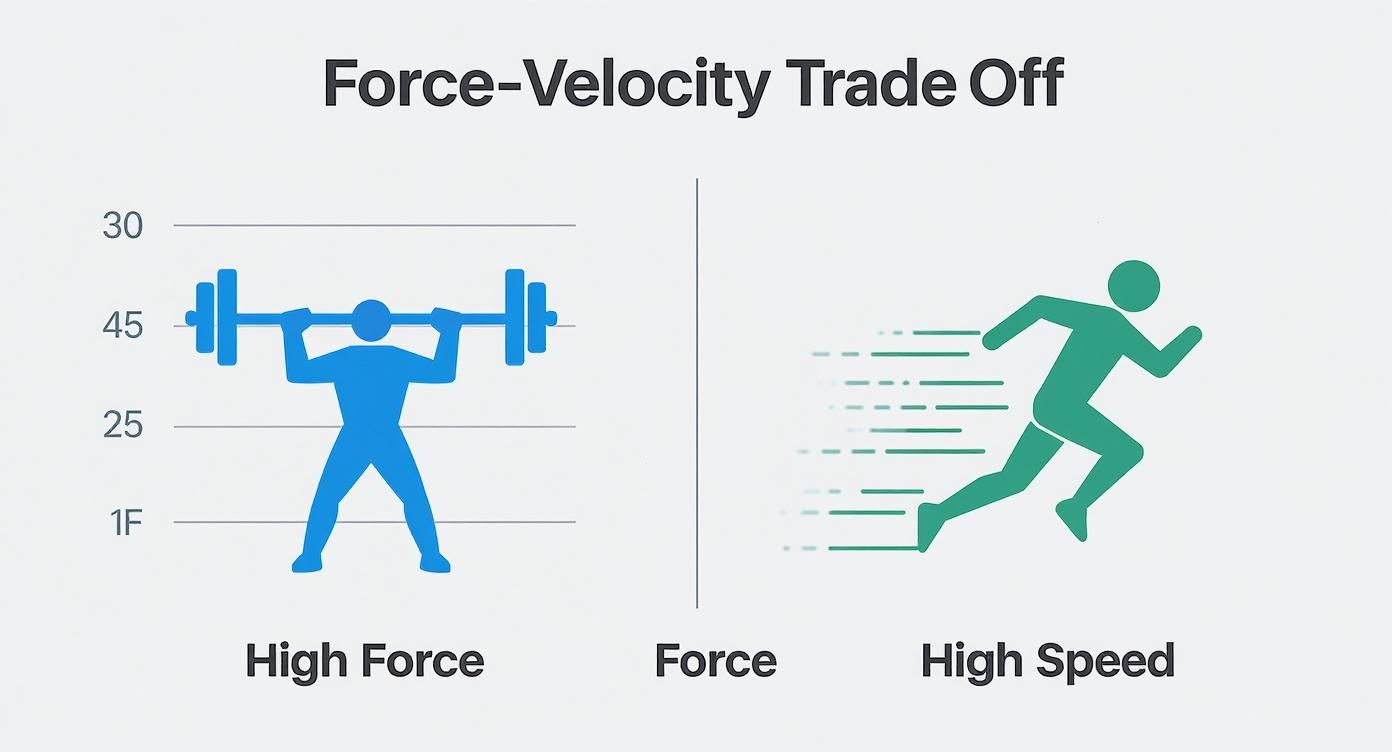
This visual captures the give-and-take inherent in muscle performance. Maximizing one variable invariably means compromising the other.
Key Landmarks of the Curve
To properly interpret this performance map, we must understand its key landmarks. These points anchor the curve and provide tangible numbers for assessing an athlete or patient. They represent the theoretical maximums for force and speed.
On the concentric (muscle shortening) part of the curve, there are two main points:
- Maximum Isometric Force (Fₘₐₓ): This is the peak force a muscle can generate without changing length (i.e., at zero velocity). Imagine pushing against an immovable wall. This point is the y-intercept of the curve.
- Maximum Velocity (Vₘₐₓ): This is the theoretical maximum speed at which a muscle could shorten if it had zero external resistance. While a true zero-load scenario is not achievable in practice, this concept serves as a useful biomechanical marker. At this point, force production is zero. This is the x-intercept of the curve.
The Concentric and Eccentric Relationship
The classic force-velocity curve primarily describes concentric contractions, which occur when a muscle shortens to produce force, like lifting a dumbbell during a bicep curl. As you attempt to lift that weight faster (increase velocity), the number of simultaneous cross-bridge formations within the muscle fibers decreases, leading to a reduction in force production (2).
But what happens when a muscle lengthens under load? This is an eccentric contraction, such as when you slowly lower that heavy dumbbell.
Interestingly, the eccentric part of the curve does not follow the same pattern. It sits above the concentric curve, indicating that our muscles can produce significantly more force during eccentric actions than during concentric or even isometric ones.
This is why you can control lowering a much heavier weight than you can lift. Scientific evidence suggests this is due to contributions from passive elastic tissues within the muscle and different cross-bridge mechanics that occur during lengthening (3).
Applying the Curve to Training
Understanding the shape of this curve has direct, practical applications for designing training programs. Different training methods target different zones of the curve to develop specific physical qualities.
- Strength Training (High Force, Low Velocity): Heavy lifting, such as a one-repetition maximum squat, occupies the far left of the curve. The primary goal here is to increase Fₘₐₓ, which effectively shifts the entire curve upward.
- Speed Training (Low Force, High Velocity): Activities like unloaded sprints, plyometric jumps, or throwing a light medicine ball target the far right of the curve. This type of training aims to improve Vₘₐₓ, shifting the curve to the right.
- Power Training (Moderate Force & Velocity): Power is the product of force and velocity, and it peaks somewhere in the middle of the curve. Training with moderate loads moved at high speeds—such as in Olympic weightlifting or loaded jumps—is how this "sweet spot" for peak power is targeted.
By identifying an athlete's profile—whether they are force-dominant or velocity-dominant—a coach or clinician can assign exercises that specifically target the weaker portion of their curve. This targeted approach enhances training efficiency and helps create a more balanced, powerful athlete.
References
- Hill AV. The heat of shortening and the dynamic constants of muscle. Proc R Soc Lond B Biol Sci. 1938;126(843):136-95.
- Alcazar J, Csapo R, Ara I, Alegre LM. On the Shape of the Force-Velocity Relationship in Skeletal Muscles: The Linear, the Hyperbolic, and the Double-Hyperbolic. Front Physiol. 2019;10:769.
- Douglas J, Pearson S, Ross A, McGuigan M. Chronic Adaptations to Eccentric Training: A Systematic Review. Sports Med. 2017;47(5):917-941.
Finding the Power Sweet Spot
If force and velocity are the ingredients, power is the final dish. In movement science, power is defined as the product of force and velocity. It is this interplay that dictates explosive performance.
Interestingly, when examining the force-velocity curve, peak power does not occur at the extremes. It isn't achieved by lifting the heaviest possible weight, nor by moving at the fastest speed with no load. The optimal output happens in the middle.
- Peak Power is found at the intersection of moderate force and moderate velocity.
- Consider a sprinter exploding out of the blocks or an athlete soaring for a vertical jump—both are excellent examples of hitting this sweet spot.
- This is precisely why generic training programs may fall short; they often do not account for an individual's unique power profile.
A sprinter in the blocks is not lifting a maximal load, but they are generating a massive amount of force against the blocks and converting it into velocity almost instantly. That is the sweet spot in action. A vertical jump operates on the same principle—it tests how well an athlete can apply force rapidly to translate it into upward speed.
The Power Curve Visual
The graph below makes this concept clear. A power curve (the red line) is overlaid on top of the traditional force-velocity plot (the blue dots).
You can see power building from the high-force, low-velocity end (Fₘₐₓ), peaking in the mid-range, and then tapering off as it approaches the high-velocity, low-force end (Vₘₐₓ).
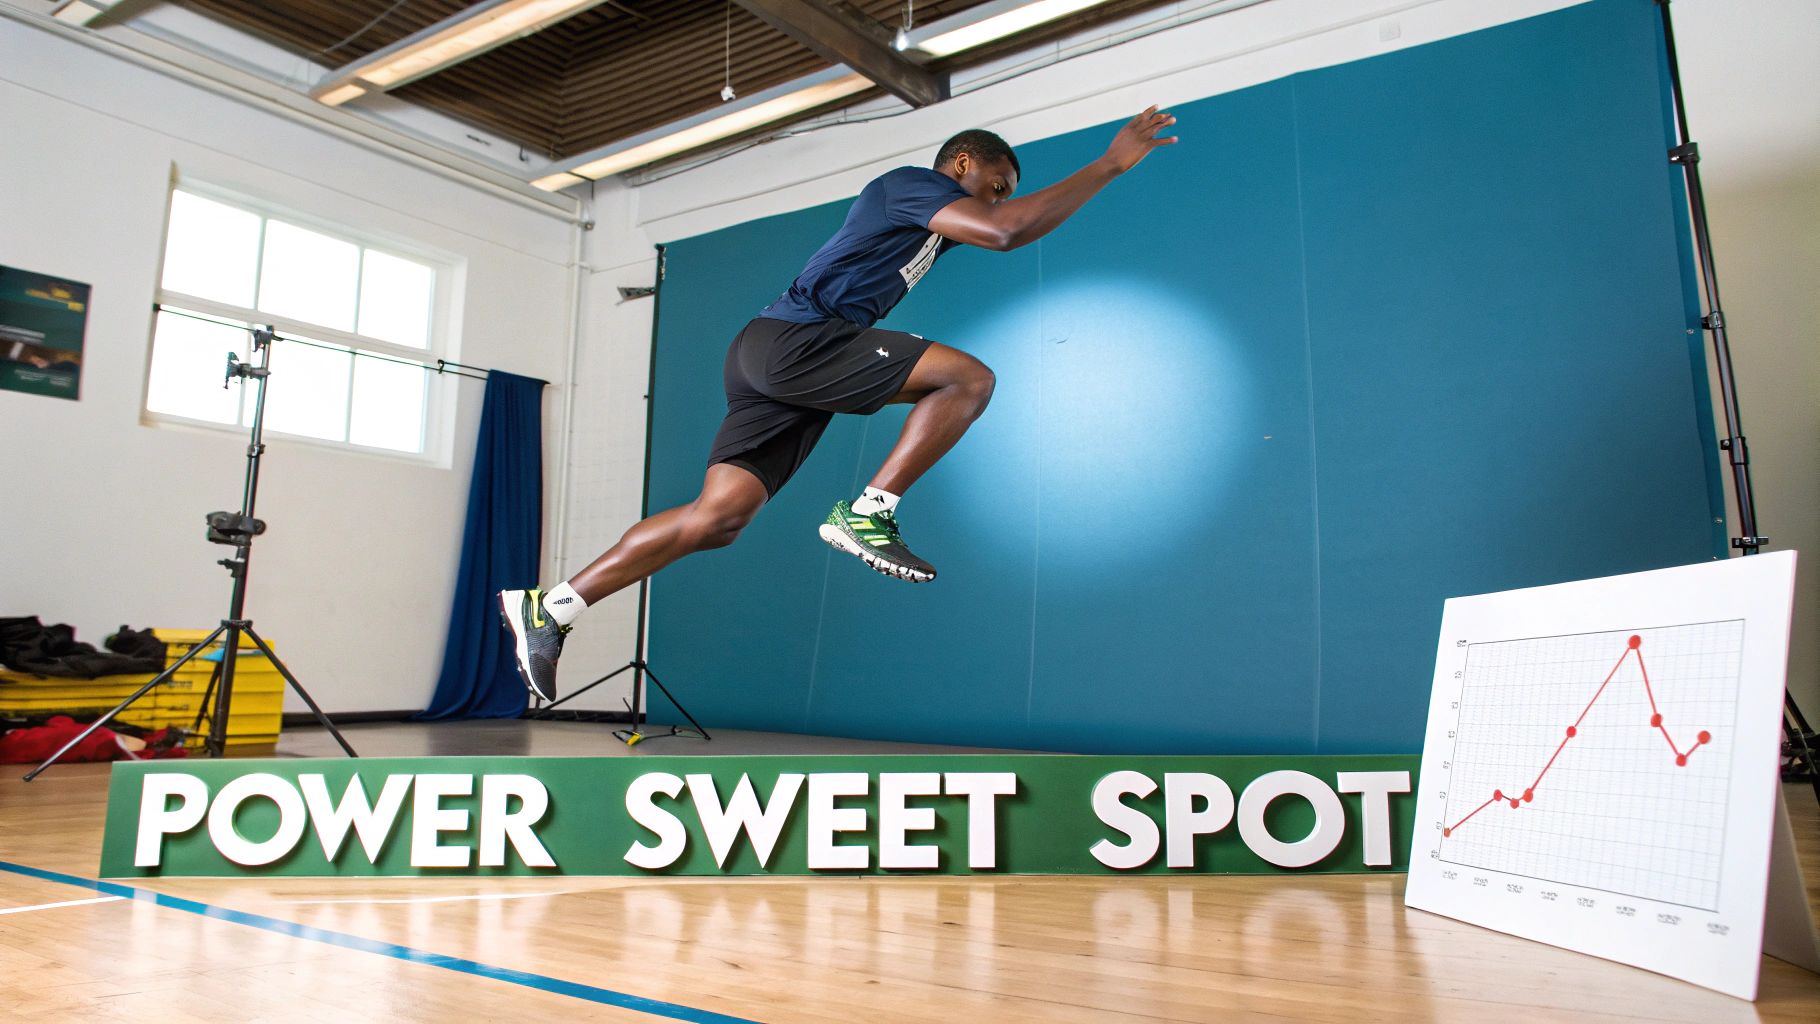
This visual is a powerful reminder of why some "power" circuits may miss the mark if they are not programmed at the right load to truly maximize an athlete's output.
"Knowing an athlete’s power peak allows training at loads that matter most for performance gains." — Strength Coach Insight
This gets to the heart of why profiling is becoming a necessity for both therapists and coaches. It helps us understand an athlete's strengths. Some athletes are force-dominant, like a shot putter, whose power comes from moving very heavy loads at slower speeds. Others are velocity-dominant, like a 100-meter sprinter, who generates power by moving their body at very high speeds.
By profiling an athlete, we can:
- Pinpoint the specific loads and speeds that will most effectively boost their power.
- Move away from generic programming that fails to target their individual needs.
- Build customized programs that align with their unique force-velocity signature.
Tools like dynamometers and force plates are used to accomplish this by capturing force and velocity data simultaneously. This data drives smart, effective load-velocity prescriptions in both clinical and performance settings.
Practical Recommendations
To put this into practice, one might test an athlete across a spectrum of loads—from heavy to light—to map out their personal force-velocity curve.
From there, you can identify the load-velocity combination where their power output peaks. This becomes the anchor point for their training. Instead of one-size-fits-all workouts, a blend of moderate loads moved with explosive intent can train them at the epicenter of their power production.
This also allows for more strategic periodization, with training blocks designed to emphasize force, others to focus on velocity, and still others that directly target the peak power zone.
For more information on how to conduct these assessments, our guide on force plate testing is a valuable resource.
Aligning training with an individual's power sweet spot can lead to more efficient performance gains. This targeted approach may also help reduce injury risk by ensuring athletes are not constantly working with excessive loads outside their optimal range.
Tracking Long-Term Changes
An athlete's power profile is not static. As they become stronger and faster, the peak on the curve will shift. Regular re-assessment is therefore critical to ensure programming evolves alongside their capabilities.
A full laboratory workup is not necessary every week. Integrating quick checks, such as loaded jumps or dynamometer readings every 4–6 weeks, is often sufficient to monitor progress. This creates a powerful feedback loop, keeping athletes engaged as they see tangible progress beyond simply adding more weight to the bar.
Key Takeaway: The sweet spot for power is not fixed—it evolves with strength, speed, and training focus.
Ultimately, mastering the force-velocity relationship is about unlocking personalized power training. It is about delivering sustainable improvements, safely and effectively.
Measuring Force-Velocity Profiles
Understanding the force-velocity relationship is one thing, but measuring it is what translates theory into real-world results. To move from concept to application, we need reliable tools and consistent protocols. Modern technology provides several ways to capture an individual’s unique force-velocity profile, arming clinicians and coaches with the data needed to drive both performance and rehabilitation.
Profiling is not about a single test. It involves capturing performance across a spectrum of loads to uncover an athlete's "movement signature"—are they naturally force-dominant, velocity-dominant, or well-balanced? This information is essential for designing truly targeted training.
Common Tools for Profiling
Choosing the right tool often depends on the setting, budget, and specific goals. Each piece of equipment offers a different window into an individual's capabilities, from the highly controlled laboratory environment to more dynamic field settings.
Here is a look at some common instruments used today:
- Isokinetic Dynamometers: Often considered a gold standard in clinical settings, these devices measure force at a constant, preset speed. They are excellent for isolating specific muscles and obtaining detailed data on torque production through a full range of motion.
- Force Plates: These platforms measure ground reaction forces with high precision. When an athlete jumps or squats on them, force plates capture force, velocity, and power output, providing a comprehensive picture of lower-body explosive strength.
- Linear Position Transducers (LPTs): For a more portable and gym-friendly option, LPTs are useful. They attach to a barbell or the athlete and measure movement velocity. By testing across various weights, coaches can quickly build a load-velocity profile to guide training.
- Handheld Dynamometers: These portable devices are ideal for assessing isometric strength in nearly any setting. While they do not directly measure velocity, they provide a crucial data point for the high-force, zero-velocity end of the curve (Fₘₐₓ). For a practical walkthrough, see this guide on how to use a dynamometer.
Key Takeaway: The goal of profiling is to collect at least three data points across a range of loads—from light to heavy—to accurately plot an individual’s force-velocity curve.
To help determine which tool is the best fit, the table below breaks down the pros and cons of each.
Comparison of Force-Velocity Assessment Tools
This table summarizes common tools for F-V profiling, outlining their primary measurements and key benefits and limitations.
| Tool | Primary Measurement | Pros | Cons |
|---|---|---|---|
| Isokinetic Dynamometer | Torque at constant velocity | Highly controlled and reliable for isolated joint testing. | Expensive, not portable, and less sport-specific. |
| Force Plate | Ground reaction force, velocity | Comprehensive data on multi-joint movements like jumps. | High cost, requires a stable surface and data interpretation skills. |
| Linear Position Transducer | Barbell or body velocity | Portable, affordable, and provides instant feedback in the gym. | Less accurate for complex or rotational movements. |
| Handheld Dynamometer | Isometric force | Extremely portable, affordable, and excellent for clinical use. | Measures only isometric force, not dynamic movements. |
Ultimately, the best tool is one that provides reliable, actionable data. The insights gained from any of these instruments can help tailor programming to the individual.
Sample Squat Jump Protocol
One of the most effective and accessible ways to build a force-velocity profile is with a multi-load vertical jump protocol, using either a force plate or a linear position transducer. The squat jump is a foundational movement that translates directly to athletic performance.
This protocol can be adapted to your specific environment.
Step-by-Step Assessment:
- Warm-Up: Begin with a standardized dynamic warm-up, including bodyweight squats and submaximal jumps to prepare the neuromuscular system.
- Unloaded Jumps: Have the athlete perform 2-3 maximal countermovement jumps with only their body weight. This provides the high-velocity, low-force data point (Vₘₐₓ).
- Loading Progression: Start with an external load of approximately 20% of the athlete's body weight, using a barbell, trap bar, or weighted vest. Have them perform 2 maximal jumps.
- Incremental Loading: Continue increasing the load in 20% increments, with the athlete performing 2 maximal jumps at each stage. Proceed until jump height drops significantly or movement form deteriorates. It is important to allow 2-3 minutes of rest between sets for adequate recovery.
- Data Plotting: For each load, record the peak force and peak velocity. Plot these points on a graph with force on the y-axis and velocity on the x-axis to visualize the individual's unique force-velocity relationship.
This simple yet powerful protocol provides actionable data that can immediately inform training decisions, enabling programming with precision to turn weaknesses into strengths.
Applying Force-Velocity Profiles In Sports And Rehabilitation
Once an athlete’s force-velocity signature has been measured, the numbers become a personalized playbook. This data acts as a compass, pointing directly to the factors limiting performance.
Is the issue strength that lacks speed, or speed that lacks a solid force foundation? The profile provides a clear answer, replacing guesswork with precision programming.
Tailoring Training For Elite Performance
In elite sports, small adjustments can make a significant difference. Force-velocity profiles often reveal a near-linear trade-off between force and speed. Different athletic disciplines exist at opposite ends of that continuum.
- Combat Athletes may exhibit high F₀ and steep, force-dominant slopes. They can generate high forces but may be slower in rapid movements.
- Sprinters often have high V₀ and shallow, velocity-dominant slopes. They are fast but may lack the force needed for powerful acceleration.
Let’s illustrate this with two practical scenarios.
Case Example 1: The Strength-Focused Combat Athlete
- Profile: Steep, force-dominant curve—high force at low speed, with a sharp drop-off as velocity increases.
- Goal: Improve the rate of force development (RFD) for harder, faster strikes.
- Intervention:
- Ballistic drills with moderate to heavy loads: loaded jumps, kettlebell swings, medicine ball slams.
- Emphasize maximal intent: lift heavy but move with explosive speed.
Case Example 2: The Velocity-Focused Sprinter
- Profile: Shallow, velocity-dominant curve—excellent limb speed but weaker in the initial acceleration phase.
- Goal: Improve the drive phase out of the starting blocks.
- Intervention:
- Strength-speed work at 70–90% of 1RM with an explosive focus.
- Heavy sled pushes, deep squats, and hang power cleans to shift the entire F-V curve upward.
Guiding Rehabilitation With Precision
In rehabilitation, it is important to identify not just if a muscle is weak, but how it is weak. This distinction shapes exercise selection.
Key Takeaway: An F-V profile can pinpoint whether deficits lie in slow, high-force tasks or in rapid, lighter movements.
Consider a patient post-ACL reconstruction:
- Deficit Identification: The operated leg may pass isometric strength tests but falter during quick, high-velocity tasks.
- Targeted Intervention: Instead of focusing solely on heavy squats, the program could introduce low-impact plyometrics—box jumps, skater hops, single-leg broad jumps—to retrain rapid force production.
This focused approach can help accelerate recovery and may lower re-injury risk by ensuring the neuromuscular system is prepared for sport-specific speeds.
Once a force-velocity curve has been mapped, every training block and rehabilitation session gains clear direction. After sessions designed to stress specific parts of the curve, learning about effective strategies for speeding up muscle recovery becomes a logical next step.
How Age Shapes the Force-Velocity Curve
The force-velocity relationship is not static; it is a dynamic profile that evolves throughout our lives. As we age, our physiological landscape shifts, with one of the most significant changes occurring in muscular power. This is not simply a matter of feeling weaker; it is a specific alteration in the force-velocity curve that impacts everyday function and long-term activity.
With age, there is a natural decline in muscle mass and function, a process known as sarcopenia. This process significantly affects the force-velocity relationship, primarily by reducing the ability to produce force, especially at higher speeds. For an older adult, the F-V curve typically shifts downward and to the left, indicating both lower maximal force (Fₘₐₓ) and a decrease in maximal velocity (Vₘₐₓ).
This loss of high-velocity strength is particularly consequential. While absolute strength is important, the ability to generate force quickly is what facilitates reactive movements—like recovering balance to prevent a fall or quickly stepping off a curb. A decline in this explosive capability is a major factor contributing to an increased risk of falls and a potential decline in functional independence among older adults.
The Science Behind Losing Power as We Age
Long-term research has documented these gradual changes. For instance, a notable longitudinal study observed a steady decline in the slope of the torque-velocity relationship (relative to maximum torque) at an approximate rate of −0.10% per year (1). This shift was particularly evident in middle-aged men and older adults of both sexes, highlighting how the ability to produce force at different speeds diminishes over time.
Key Takeaway: Age-related power loss is not just a decrease in raw strength. It is a more significant decline in the ability to generate force quickly, which directly affects functional mobility and safety.
This is where comparing an individual's data against established benchmarks becomes crucial. By understanding what normative data is for different age groups, clinicians can contextualize a person's performance and identify deficits that require targeted intervention.
Practical Ways to Counteract the Decline
Fortunately, these age-related declines are not inevitable. Smart, targeted training that addresses both ends of the force-velocity spectrum can significantly mitigate this process. The goal is to build a program that preserves both strength and speed in a safe, progressive manner.
Here are a few practical tips for designing effective programs for middle-aged and older adults:
- Combine Strength and Speed: Avoid focusing solely on heavy, slow lifting. Incorporate exercises that demand speed, such as medicine ball throws, kettlebell swings, or seated box jumps. Use lighter loads, but emphasize moving them with maximal intent.
- Prioritize Power: Power should be trained directly. This can include fast-paced sit-to-stands, rapid step-ups, or even supervised light-load Olympic lifting variations for more experienced individuals.
- Focus on Eccentric Control: Muscles can handle heavier loads eccentrically. Emphasizing the lowering phase of movements (like a slow descent in a squat) is a safe and effective way to build strength.
- Respect Recovery: Older adults may require more time to recover between intense sessions. Programs should account for this to prevent overtraining and minimize injury risk.
By strategically training across the entire force-velocity curve, older adults can maintain their functional power, improve their quality of life, and stay active and independent for years to come.
Reference
- Škarabot J, Cronin N, Strojnik V, Avela J. The role of neural and muscular mechanisms in force-velocity-power relationship of a muscle. Eur J Appl Physiol. 2016;116(11-12):2279-2289.
Force-Velocity Relationship: Your Questions Answered
Still curious about how the force-velocity relationship works in practice? Let's address some common questions to connect the science with what you do in the clinic or with athletes every day.
How Does Force-Velocity Profiling Actually Improve Training?
Think of it as moving from a generic, off-the-shelf program to a custom-tailored suit. By mapping an athlete's unique force-velocity curve, you can see precisely where their limitations lie. Are they strong but slow? Or fast but weak?
Profiling pinpoints their specific weakness—whether on the foundational strength (force) side or the explosive speed (velocity) side. This data allows for programming with surgical precision, targeting their exact needs instead of guessing. The result is more efficient and effective performance gains (1).
What's the Difference Between the Concentric and Eccentric Curves?
This is a very important distinction. The concentric curve reflects the classic inverse relationship where the faster you try to lift something (increase velocity), the less force you can produce.
However, the eccentric curve is different. It sits above the concentric one, meaning our muscles can generate significantly more force while lengthening under load (like lowering a heavy squat) than they can while shortening (lifting it). This is attributed to the passive elastic components of the muscle and unique behaviors of muscle fibers during lengthening contractions (2).
Key Takeaway: We are stronger when controlling heavy loads on the way down than when lifting them up. This is a game-changer for designing smarter strength and rehabilitation programs.
What Simple Tests Can I Use Outside a Lab?
You don't need a high-end biomechanics lab to get started. A multi-load vertical jump test is one of the most practical, field-friendly options.
The protocol involves having an athlete perform maximal vertical jumps, first with just their bodyweight, and then with a few progressively heavier external loads (e.g., 20%, 40%, and 60% of their bodyweight). This provides enough data points to plot a reliable force-velocity profile using tools like a linear position transducer or even a measuring tape to track jump height.
References
- Samozino P, Morin JB, Hintzy F, Belli A. A simple method for measuring force, velocity and power output during squat jump. J Biomech. 2008;41(14):2940-5.
- Douglas J, Pearson S, Ross A, McGuigan M. Chronic Adaptations to Eccentric Training: A Systematic Review. Sports Med. 2017;47(5):917-941.
At Meloq, our mission is to build accurate, portable tools that empower professionals to replace subjective guesswork with objective data. Our devices, like the EasyForce dynamometer and EasyBase force plate, are designed to make force-velocity profiling simple and accessible, regardless of the setting.
Discover how our ecosystem can bring a new level of precision to your assessments by visiting https://www.meloqdevices.com.

Featured Product
EasyForce Digital Dynamometer
Handheld muscle strength testing with 99% accuracy. Used in 40+ peer-reviewed studies.
Learn More