
Your Ultimate Guide to Dynamometer Grip Strength Norms
Team Meloq
Author
When we talk about grip strength, how do we know what is considered "strong" or "weak"? That is where dynamometer grip strength norms come into play. They are standardized reference values, often broken down by age and sex, that allow for the comparison of an individual's hand strength against a representative peer group.
These norms provide a solid baseline for interpretation. For instance, data from scientific literature suggests that peak strength for young men is typically in the 40-50 kg range, while for young women, it is around 25-35 kg (1). From that peak, a predictable decline generally occurs with age. Using a dynamometer provides the objective numbers to see exactly where someone stands relative to these population-based standards.
Understanding Grip Strength Norms and Their Importance
In physiotherapy, conditioning, and general health assessment, grip strength norms are indispensable. They provide a benchmark for "normal" strength, which is critical for identifying weakness that might point to underlying issues like sarcopenia or frailty (2). In a way, they are like the growth charts used for children, but for adult muscle strength.
These values are not arbitrary. They are built from large-scale population studies where researchers collect data from thousands of individuals to create robust benchmarks. If you are curious about the science behind creating these comparison tools, our guide on what is normative data is a great place to start. This foundation allows for a precise, data-driven approach to any evaluation.
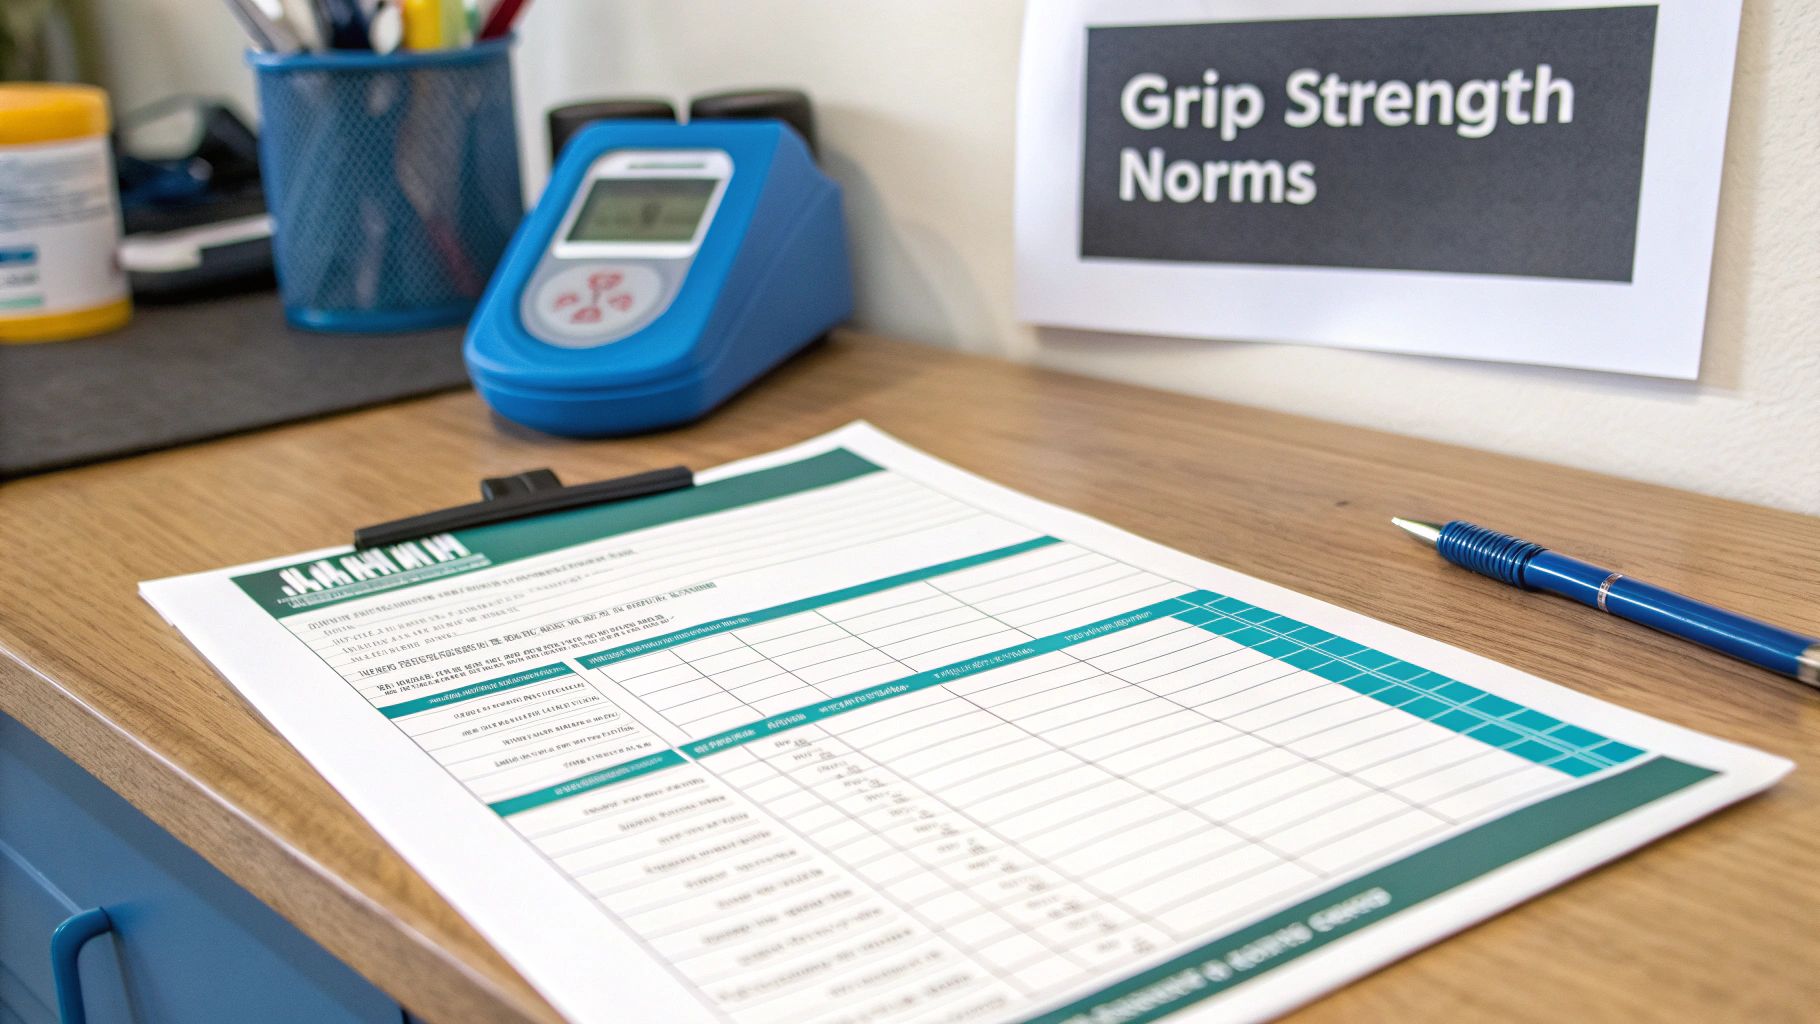
Grip Strength Norms At a Glance (Kilograms)
This table gives a quick snapshot of average peak grip strength for young adults and representative values for older adults, based on international normative data. All values are approximate and for the dominant hand. It is important to consult detailed, peer-reviewed tables for clinical use.
| Age Group | Average Male Grip Strength (kg) | Average Female Grip Strength (kg) |
|---|---|---|
| 20-29 | 40-50 | 25-35 |
| 70-79 | 35-40 | 20-25 |
Note: These ranges are illustrative and compiled from various population studies (1).
These figures clearly illustrate the peak strength seen in young adulthood and the natural decline that occurs later in life, reinforcing the need for age-specific comparisons.
Why Are These Norms Clinically Relevant?
The clinical relevance of this data is immense. A major recent analysis collated data from 100 studies, covering 2.4 million adults across 69 countries, to establish international benchmarks (3). The findings were clear: strength peaks in young adulthood and then progressively declines.
By the time people reach their 70s (ages 70-79), men’s average grip strength has dropped to about 35-40 kg, and women’s to 20-25 kg (1, 3).
This data is crucial in the clinic for a few key reasons:
- Objective Assessment: It removes guesswork. Instead of a subjective impression of strength, you have hard numbers.
- Goal Setting: Clinicians can set rehabilitation targets that are not only realistic but also measurable.
- Risk Identification: Low grip strength compared to norms is a powerful predictor of poor health outcomes, including increased mortality risk (4, 5).
Ultimately, when a practitioner takes a measurement from a dynamometer and compares it to established norms, they gain powerful insights into a person's overall health and functional capacity. It is a simple test with profound implications.
Why Grip Strength Is a Critical Health Indicator
It is easy to think of grip strength as just a measure of hand function, but scientific literature reveals it offers a profound window into our overall health. Research is clear: it is a reliable proxy for total-body muscle strength and has been proposed as a key vital sign (4, 6). Think of it less like a test of your handshake and more like a quick, non-invasive physical assessment.
This single measurement is powerful because it correlates so strongly with numerous health outcomes. A weaker grip can be an early warning sign for conditions that affect the entire body, providing objective data that helps clinicians move beyond guesswork.
A Predictor of Overall Health and Longevity
The link between hand strength and longevity is remarkably strong. Peer-reviewed studies consistently show that individuals with lower grip strength for their age and sex face a higher risk of all-cause mortality (5, 7). A weak grip can signal underlying vulnerabilities long before other symptoms appear.
This predictive power is not just general—it's specific. Low grip strength is tied to an increased risk of cardiovascular events like heart attacks and strokes (6). It also serves as an indicator of frailty, nutritional status, and even cognitive decline, making it an incredibly versatile biomarker for health professionals (2).
Sarcopenia and Functional Decline
One of the most vital uses for dynamometer grip strength norms is in identifying sarcopenia, the age-related loss of muscle mass and function. Since grip strength reflects overall muscle integrity, a low reading is a primary diagnostic criterion for this condition (8). Identifying sarcopenia early is critical for effective intervention.
On a practical level, understanding baseline grip strength is key to developing effective strategies for preventing elderly falls and maintaining independence in older adults. Maintaining muscle strength is directly tied to preserving quality of life as we age. For a closer look at how measurements support clinical goals, check out our article on the objective of measurement.
Low grip strength signals heightened risks—elevated all-cause mortality, cardiovascular disease, and physical disability—making it a non-invasive predictor clinicians can't ignore. For orthopedic surgeons and athletic trainers, these norms enable precise patient tracking and policy evaluations, like monitoring public health interventions' impact on sarcopenia rates, which affect 10-30% of those over 65 in major markets. Read the full research about these findings.
For physical therapists and conditioning specialists, tracking grip strength provides invaluable data. It helps justify interventions, monitor a client's progress objectively, and improve communication by showing tangible, measurable results. It is a simple test that can be a cornerstone of a complete physical assessment, providing insights that go far beyond the hand itself.
Standardized Protocol for Measuring Grip Strength
For grip strength measurements to be reliable and comparable to established norms, following a standardized testing protocol is non-negotiable. Without consistency, results can vary, making it difficult to accurately track a patient's progress or see how they compare against reference data. A structured approach eliminates variables and ensures the data collected is both valid and meaningful.
This is why organizations like the American Society of Hand Therapists (ASHT) have laid out clear guidelines (9). In the clinic or in research, adhering to an evidence-based protocol is considered best practice. It covers everything from how the patient sits to how the final score is recorded, creating a repeatable process.
Correct Patient Positioning
The foundation of any good test is proper patient positioning. Even small deviations can significantly alter the outcome, so getting this step right is crucial.
- Seating: The individual should sit comfortably in a chair without armrests, with their feet flat on the floor.
- Posture: They should sit upright with their shoulder adducted (kept close to their side) and neutrally rotated.
- Arm Placement: The elbow must be flexed at a 90-degree angle, with the forearm in a neutral, thumb-up position. The wrist should be held straight or in slight extension, between 0-30 degrees (9).
This specific posture is designed to isolate the forearm and hand muscles, preventing compensation from larger muscle groups in the shoulder or back, which can affect the reading. Following these steps standardizes the biomechanics of the test across different people and sessions. For a more practical walkthrough, you can check out our detailed guide on how to use a dynamometer.
Testing Procedure and Instructions
Once your patient is positioned correctly, the test can begin. Instructions must be clear and the procedure consistent to obtain a true maximal effort.
- Dynamometer Setting: First, adjust the dynamometer's handle to fit the user’s hand comfortably. The second handle position is a common starting point, but it should be adjusted for the individual (9).
- Patient Instructions: Instruct the patient to squeeze the handle as hard as they possibly can for about three seconds. Verbal encouragement like, "Harder, harder, squeeze!" is recommended to elicit a maximal effort.
- Number of Trials: The standard is three consecutive trials on each hand, with a rest of about 15-60 seconds between each attempt to allow for muscle recovery (9).
- Recording the Score: Record the results from all three trials. Some clinicians use the single highest score, while others take the average of the three. Either method is acceptable, but the key is to be consistent in your approach.
Common Mistakes to Avoid: Small errors can have a big impact. Allowing the elbow to drift away from the body or giving inconsistent verbal cues are common issues. These might seem minor, but they introduce variability that can skew results and undermine the value of using dynamometer grip strength norms.
Detailed Normative Data Tables by Age and Sex
As a clinician or coach, having a solid set of dynamometer grip strength norms is essential. These benchmarks, derived from extensive peer-reviewed research, are what give measurements meaning. Without them, a reading of 35 kg is just a number. With them, that same number can signal healthy aging, track rehabilitation progress, or raise a potential red flag.
The data below breaks down grip strength values across different age brackets for both men and women. Sourced from large-scale population studies, these numbers are presented in kilograms (kg), making them easy to compare in any clinical setting (1, 10). The tables show both the mean (average) score and the standard deviation (SD), which indicates the typical spread of scores around that average.
How to Use the Normative Data Tables
Using these tables is straightforward. Find the row that matches your client's age and the columns for their sex. This provides the average grip strength for their demographic, offering immediate context for your measurement. It is a quick way to see how their strength compares to their peers.
Of course, for any comparison to be valid, you must follow a consistent measurement protocol. The infographic below outlines the simple, standardized steps for getting a reliable grip strength reading.
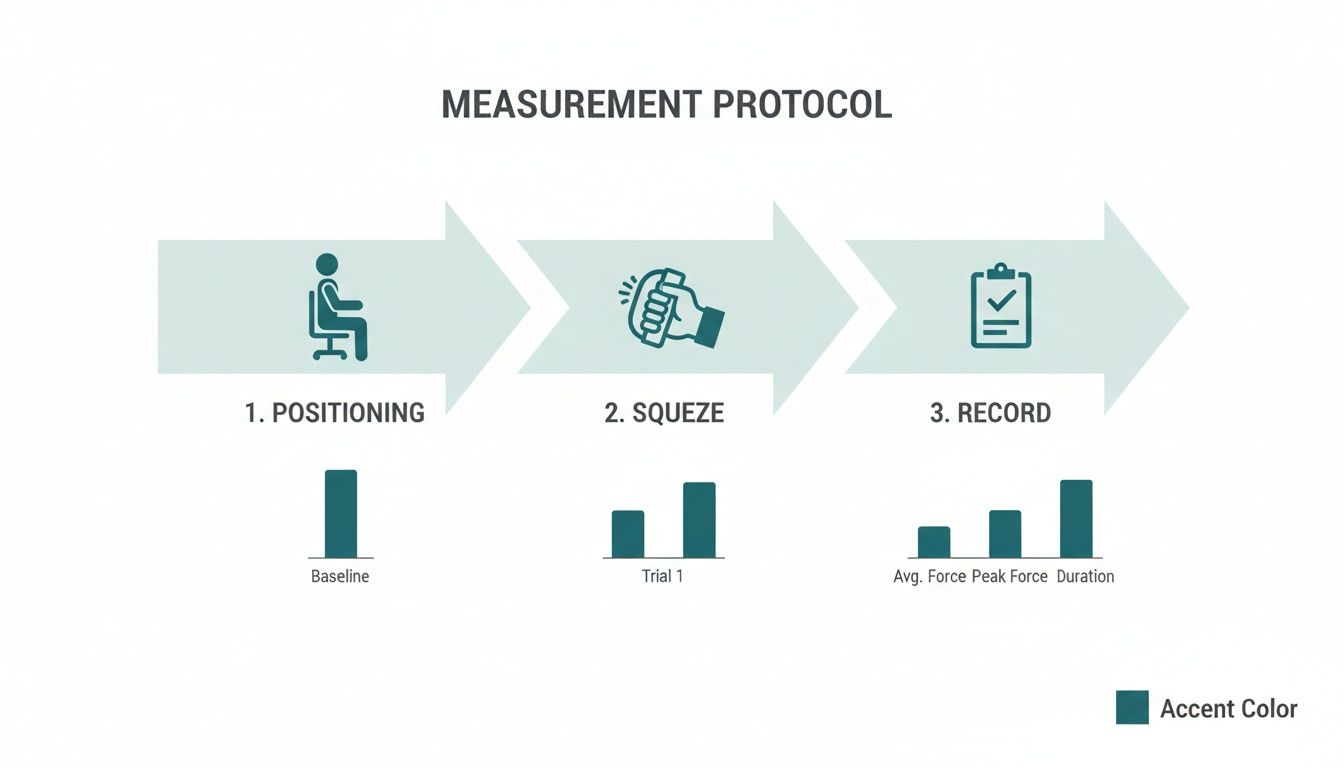
This visual guide emphasizes the three core pillars of a solid test: proper positioning, a true maximal effort from the client, and accurate recording. By mastering these three, you can be confident your data is comparable to established norms.
Normative Grip Strength Data by Age and Sex (Mean ± SD)
The following table presents detailed normative grip strength data in kilograms (kg) for the dominant hand, compiled from large-scale population studies. Use these values as a reference to compare individual patient measurements.
| Age Group (Years) | Male Mean (kg) | Male SD (kg) | Female Mean (kg) | Female SD (kg) |
|---|---|---|---|---|
| 20-29 | 49.2 | 8.1 | 29.5 | 5.8 |
| 30-39 | 50.1 | 8.4 | 30.1 | 6.1 |
| 40-49 | 48.3 | 8.9 | 28.7 | 6.5 |
| 50-59 | 44.5 | 9.2 | 25.9 | 5.9 |
| 60-69 | 38.6 | 8.5 | 22.4 | 5.2 |
| 70-79 | 32.1 | 7.6 | 19.3 | 4.8 |
| 80+ | 24.5 | 6.7 | 15.5 | 4.1 |
Data adapted from consolidated findings in large-scale international studies (1, 10).
A clear pattern is visible. Grip strength tends to peak between the ages of 30-39 for both men and women before starting a gradual, steady decline. This is a normal part of the aging process and highlights why comparing a 75-year-old's strength to that of a 35-year-old is not appropriate. Using age-specific norms is the only way to make a fair and accurate interpretation.
Worked Example in a Clinical Setting
Let's put this into practice. A physical therapist is assessing a new patient: a 65-year-old female. Following the standardized protocol, the PT measures her dominant hand's grip strength and gets a reading of 18 kg.
- Find the Norm: The therapist refers to the table, focusing on the 60-69 age bracket for females. The mean value is 22.4 kg, with a standard deviation (SD) of 5.2 kg.
- Interpret the Result: The patient’s 18 kg score is below the average of 22.4 kg. It falls just within one standard deviation of the mean (22.4 - 5.2 = 17.2 kg), so while it is on the lower side, it may not be immediately alarming on its own.
- Clinical Action: This objective data point gives the therapist a reason to investigate further. They can now start a conversation about activity levels, nutrition, and other factors. Most importantly, the initial 18 kg reading serves as a concrete baseline to track progress and set realistic goals for a strength-building program.
Interpreting Results with Regional Considerations
When using dynamometer grip strength norms, it is crucial to remember they are not a one-size-fits-all solution. While standardized data tables provide an excellent baseline, they do not always tell the whole story. Geographical location and associated lifestyle factors can significantly impact muscular strength. Applying a single set of norms universally can lead to incorrect conclusions.
This nuance is important for clinicians working with diverse populations. Assuming a universal standard applies to everyone might lead to misclassifying an individual as weak or frail when their strength is normal for their specific region. Interpreting the numbers requires not just technical knowledge, but also cultural and geographical awareness.
Global Variations in Grip Strength
Major scientific analyses have confirmed that grip strength varies considerably around the globe (10). These differences are not random and often correlate with a country's economic development, public health, and dominant lifestyles.
For example, research shows that norms from developed countries tend to be similar. A landmark systematic review found that grip strength in places like the USA, Canada, UK, Sweden, and Australia was very close to established British norms, with only a small difference of 0.12 standard deviations above. In contrast, data from developing regions showed a pooled score that was -0.85 standard deviations lower, translating to an average grip strength that is roughly 20% lower (10). You can discover more insights from this comprehensive analysis to see the careful controls used in these comparisons.
The key takeaway is that using norms developed in North America or Europe to assess a client from a developing nation could create a misleading picture of their health. This might cause unnecessary concern or lead to interventions that are not needed.
Underlying Factors and Best Practices
What drives these regional differences? While more research is needed to determine the exact causes, several factors are likely at play:
- Nutritional Status: Diet and access to quality protein can have a massive impact on muscle development and maintenance.
- Physical Activity Levels: Lifestyles, the physical demands of common occupations, and cultural views on exercise vary significantly between regions.
- Body Size and Composition: Anthropometric differences, such as average height and body mass, will naturally influence absolute strength measurements.
Despite these variations, the importance of a standardized measurement protocol cannot be overstated. Adhering to a consistent testing method controls for procedural variables, ensuring that observed differences are real and not artifacts of inconsistent testing. Whenever possible, practitioners should seek out region-specific normative data to make their assessments as accurate and fair as possible. This approach helps interpret results with greater precision and provide care that is both evidence-based and culturally informed.
Putting Grip Strength Norms to Work in Your Practice
Raw data from a dynamometer is just a number. Its real value emerges when that number is translated into a meaningful clinical insight, which is precisely what dynamometer grip strength norms enable. These reference values are not just for academic papers; they are practical, everyday tools for setting goals, tracking progress, and making confident decisions in both rehabilitation and performance settings.
Comparing a client’s measurement to established norms is how we move from subjective assessments like "they feel weaker" to objective, data-driven practice. This simple step provides the context needed to understand what a specific grip strength score truly means for that individual, allowing for a personalized plan of action.
A Case Study in Post-Stroke Rehabilitation
Imagine a physical therapist working with a 72-year-old man recovering from a stroke that has weakened his right side. His initial assessment shows a grip strength of 21 kg in his affected right hand. Here is how normative data would be used:
- Assessment: First, a reliable baseline measurement is obtained using a digital dynamometer.
- Comparison to Norms: The normative data table shows that the average grip strength for men in the 70-79 age bracket is around 32.1 kg. The patient’s score is clearly well below the mean.
- Interpretation: This is a significant deficit that confirms the functional impact of the stroke and provides a concrete starting point for therapy.
- Clinical Action: Armed with this data, the therapist can set a realistic, incremental goal—for instance, aiming to improve his strength to 25 kg over the next eight weeks. This creates an objective target that helps motivate the patient and provides a clear metric for documenting progress for him and any insurance providers.
A Case Study in Sports Performance
Now, consider a different scenario. A sports performance coach is assessing a 24-year-old male rock climber returning to training after a wrist injury. Before the injury, his dominant hand grip strength was consistently 55 kg.
- Assessment: His current grip strength is measured at 48 kg.
- Comparison to Norms: His score is compared to two benchmarks. It is below his personal pre-injury baseline of 55 kg. It is also slightly below the peak average for his age group, which is around 49-50 kg.
- Interpretation: While his strength is still good compared to the general population, the drop from his personal best indicates he has not fully recovered the specific strength his sport demands. This gap signals a risk of re-injury if he returns to full-intensity climbing too soon.
- Clinical Action: A targeted grip-strengthening program is designed to close the gap between his current 48 kg and his previous 55 kg baseline. He will be re-tested weekly to objectively track his readiness for a safe return to sport.
It has long been established that grip strength follows a predictable age-related decline. Classic studies showed that men's right-hand strength can drop from a mean of 121.0 lbs (54.9 kg) in their early twenties to 64.6 lbs (29.3 kg) after age 80 (11). For therapists, these statistics are vital. A grip strength below 30 kg in a 70-year-old man can be a red flag for frailty, prompting interventions. You can read more about these rehabilitation measures here.
As these examples illustrate, normative data transforms a simple measurement into a powerful tool for personalized care, guiding everything from rehabilitation goals to return-to-play decisions.
Choosing and Calibrating a Dynamometer
Obtaining measurements that are both accurate and comparable to established dynamometer grip strength norms starts with selecting the right dynamometer. The instrument directly impacts the reliability of your data, influencing session-to-session consistency and how results compare to broader population data.
Historically, the hydraulic Jamar dynamometer has been considered the gold standard in clinical and research settings (12). Its robust design and decades of use mean that much of the foundational normative data we rely on was collected with this device. However, the landscape has evolved with the arrival of modern digital dynamometers.
These digital tools offer clear advantages over older hydraulic models. They provide a higher level of precision, often measuring force in smaller increments, and their digital screens eliminate the guesswork of reading a needle on a dial. Additionally, many digital models automatically log and store data, which simplifies documentation and tracking progress over time. For a deeper dive into the technology behind these tools, check out our article on a device to measure force.
Handling Data from Different Devices
A critical point for every practitioner is that results from different dynamometer models are not always directly interchangeable. Even a high-quality digital dynamometer might yield systematically different readings from a hydraulic Jamar due to subtle variations in handle design, size, or mechanics (12). This is significant when comparing a client's numbers to historical normative data.
To address this, researchers are developing methods to harmonize data from different devices. For instance, the world's most comprehensive international norms created sex- and age-specific benchmarks by carefully adjusting for the type of dynamometer used. These adjustments could involve tweaking results by up to 10% for non-Jamar models and as much as 17% for different testing protocols to create a more unified standard (3).
This highlights a vital best practice: whenever possible, stick with the same dynamometer for all follow-up measurements with a client. Consistency is paramount for tracking change accurately, as it removes device variability from the equation.
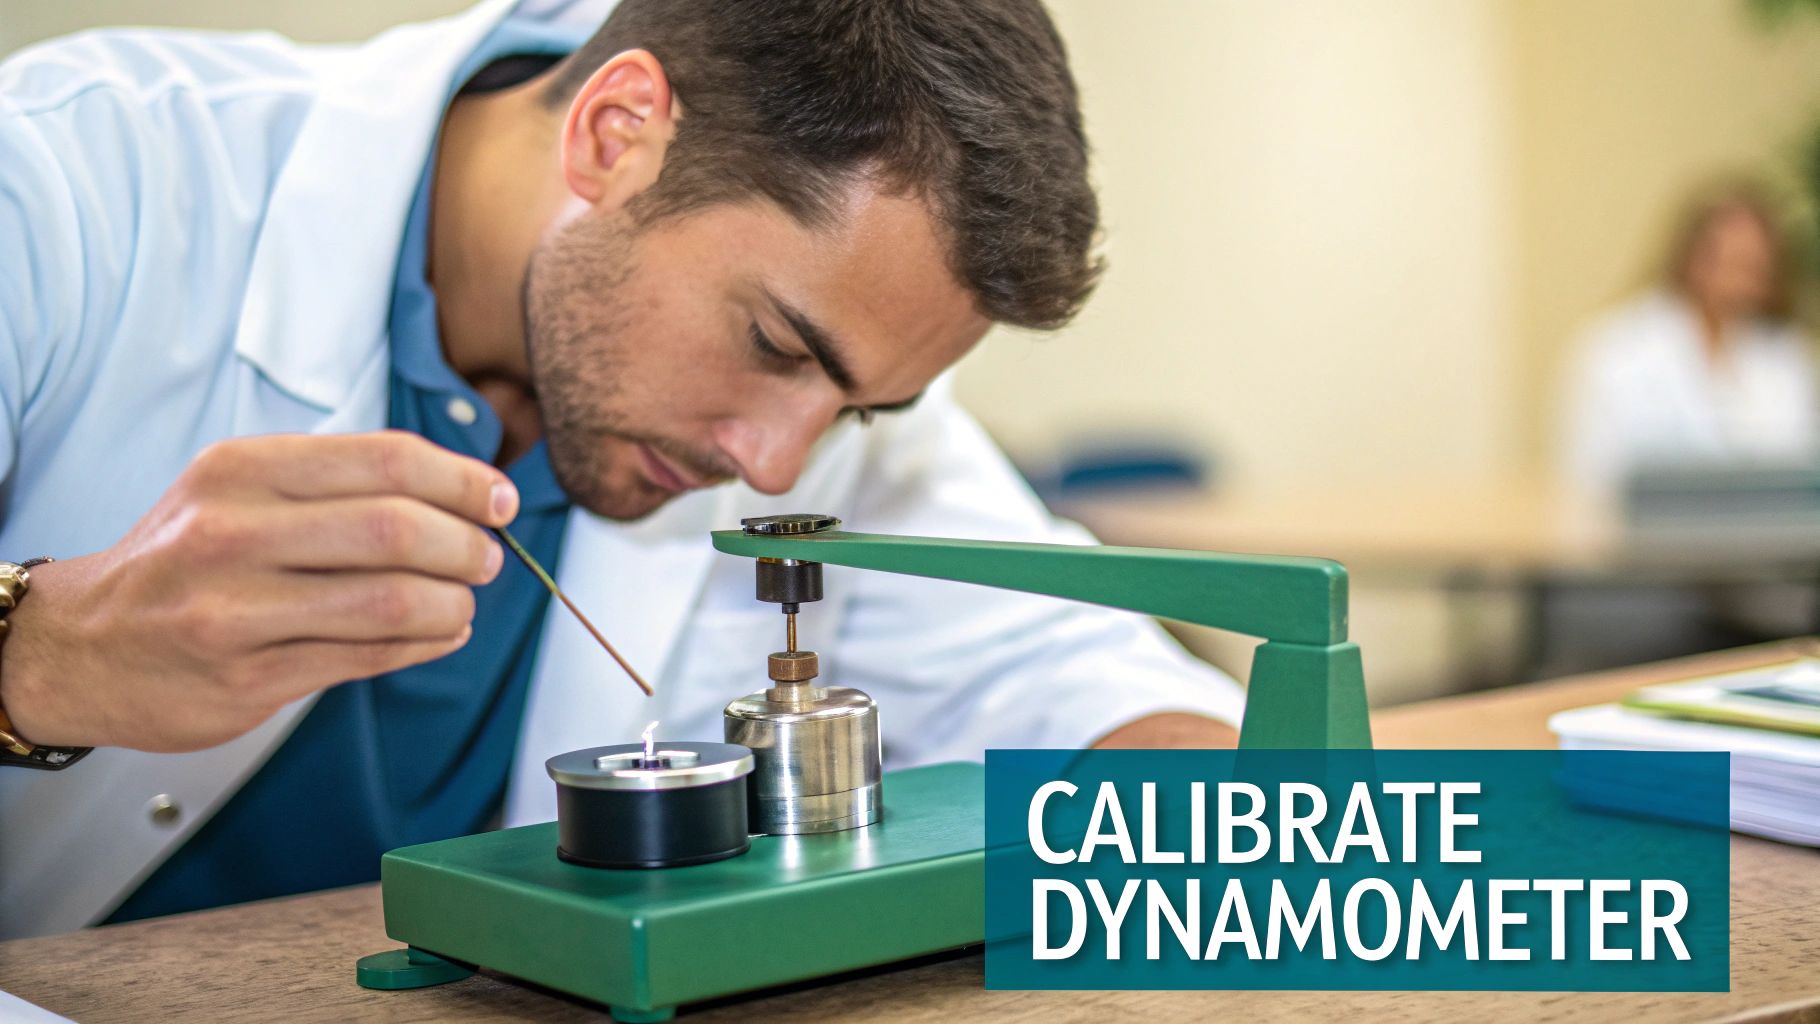
Calibration and Maintenance for Long-Term Accuracy
Regardless of the type of dynamometer used, regular maintenance and calibration are non-negotiable for accuracy and reliability. A device that has drifted out of calibration can produce misleading data, which could compromise clinical decisions and client outcomes.
Here are a few practical steps to keep your device in top condition:
- Follow Manufacturer Guidelines: Always adhere to the calibration schedule recommended by the manufacturer.
- Regular Checks: Periodically check that the needle or digital display returns to zero properly.
- Professional Servicing: For hydraulic models, professional calibration is often recommended annually. Digital devices may have simpler user-calibration procedures.
By choosing the right device and committing to its upkeep, you ensure that every measurement you take is as accurate as possible. This diligence is fundamental to applying grip strength assessment professionally, allowing you to confidently compare your findings to established norms and make sound decisions for your clients.
Common Questions About Grip Strength
When exploring grip strength assessment, a few practical questions often arise. Whether you are a seasoned clinician or just beginning to use dynamometry, clear answers are key to using this powerful health metric correctly.
Let's address some of the most common questions.
What Is a Clinically Meaningful Change in Grip Strength?
Not every small fluctuation in a grip strength reading is significant. To distinguish real progress from measurement error, we use a concept called the Minimal Detectable Change (MDC). This is the smallest change in a score that can be considered a genuine improvement, not just a chance variation.
For grip strength, research provides some solid figures. A change of roughly 5-6 kg is often considered a significant shift in older adults, indicating that a rehabilitation program is having a real effect (13). Using the MDC helps avoid over-interpreting minor fluctuations that may not be meaningful.
How Often Should I Measure Grip Strength?
The appropriate frequency depends on the individual and the clinical context. There is no one-size-fits-all schedule.
Here is a practical approach that works for most cases:
- Initial Assessment: Always measure at the start of any treatment plan to establish a solid baseline.
- Rehabilitation: During an active therapy program, re-evaluating every 4-8 weeks is a reasonable rhythm. It is frequent enough to track progress and make necessary adjustments to the plan.
- Annual Screening: For older adults, an annual grip strength test during a routine check-up is a valuable way to monitor for early signs of frailty or sarcopenia.
Can I Use These Grip Strength Norms for Children?
No. The adult normative data presented in this guide should never be used for children or adolescents. Strength levels change dramatically during growth and development, so using adult standards would yield inaccurate and misleading results.
When assessing pediatric populations, it is essential to use separate, age- and sex-specific normative data sets created specifically for them (10). These pediatric norms are designed to account for the unique strength curves seen from early childhood through adolescence, ensuring a fair and accurate comparison.
At Meloq, we design precise, portable digital measurement tools to help rehabilitation and performance professionals replace subjective assessments with objective data. Our ecosystem of devices, including the EasyForce digital dynamometer, streamlines testing and improves patient engagement. Discover how Meloq can elevate your practice.

Featured Product
EasyForce Digital Dynamometer
Handheld muscle strength testing with 99% accuracy. Used in 40+ peer-reviewed studies.
Learn More