
Understanding the Definition of Normative Data in Clinical Practice
Team Meloq
Author
In the world of rehabilitation and sports science, how do we know what’s “normal”? That’s where normative data comes in. Think of it as a standardized "map," giving us reliable reference points for human performance metrics like strength and flexibility.
These crucial benchmarks are built by testing large, diverse groups of people. This process creates a baseline that allows us to take a single measurement and see how it stacks up against a relevant population.
What Is Normative Data and Why Does It Matter?
Ever seen a pediatric growth chart? It’s a perfect real-world example of normative data in action. That chart immediately tells you how a child's height and weight compare to thousands of other kids their age. It provides context.
Normative data does the exact same thing for clinical measurements. It transforms an isolated number—like the force a patient’s knee can produce—into a meaningful insight. It’s the context that helps us answer the most important question: "Is this result typical, or is it a red flag?"
This "map of normal" is indispensable for physiotherapists and performance specialists. It allows us to move beyond guesswork and subjective feelings to make objective, evidence-based decisions. Without these benchmarks, it would be almost impossible to know if an athlete’s recovery is on track or if a patient’s limited range of motion is truly a cause for concern.
The Foundation of Objective Assessment
At its core, normative data is the statistical backbone that lets us distinguish typical performance from atypical. By gathering data from a large, representative sample of a population, researchers establish what is considered a normal range for a specific measurement.
For instance, understanding the typical shoulder range of motion norms for a healthy 30-year-old male gives a clinician a huge advantage. It helps them accurately diagnose a potential impingement or track recovery progress after surgery with far greater confidence.
To really get a handle on this, let's break down the key pieces that make up normative data.
Key Components of Normative Data
| Component | Simple Explanation | Why It's Important in Rehabilitation |
|---|---|---|
| Representative Sample | A large, diverse group of people whose characteristics (age, gender, activity level) reflect the population you want to compare against. | Ensures the "normal" you're comparing to is actually relevant. Comparing a 70-year-old to norms for college athletes is useless. |
| Mean (Average) | The average value for a specific measurement within that group. It's the central point of the data. | Gives you a quick snapshot of the most common or typical value, like the average grip strength for a specific age group. |
| Standard Deviation (SD) | A number that shows how spread out the data is from the mean. A small SD means most people are close to the average; a large SD means there's a wide variation. | Helps you understand the "normal range." A result within 1-2 SDs of the mean is generally considered typical. |
| Percentiles | Ranks an individual's score compared to the group. Being in the 90th percentile means you scored higher than 90% of the people in the sample. | Makes it incredibly easy to communicate progress to patients. "Your strength has moved from the 20th to the 50th percentile" is clear and motivating. |
These components work together to turn a single data point into a powerful piece of clinical information.
Practical Applications in the Clinic
So, how does this play out day-to-day? In the clinic, having solid normative data gives you the confidence to:
- Make objective diagnoses: When you compare a patient's measurements to established norms, you can spot significant deficits that might point to an underlying issue. It’s no longer just a hunch.
- Set realistic goals: If a patient is in the 15th percentile for grip strength after an injury, a reasonable first goal might be hitting the 40th percentile. It provides a logical, step-by-step path to recovery, rather than shooting for an elite 95th percentile right out of the gate.
- Track progress effectively: Showing a patient their improvement from the 20th to the 50th percentile is powerful. It’s clear, motivating proof that their hard work and your treatment plan are paying off.
Ultimately, the core definition of normative data is about creating a reference point. It’s what turns raw numbers into actionable intelligence, empowering us as clinicians to deliver more precise, personalized, and effective care.
The Statistical Building Blocks of Normative Data
A single measurement, like a grip strength reading of 45 kg, is just a number floating in space. To bring it down to earth and give it real meaning, we have to compare it against a larger, relevant group. This is where statistics come in, acting as the engine that turns raw numbers into powerful clinical insights.
Think of it this way: statistics give us the grammar to tell a clear story about an individual's performance relative to their peers. Three core concepts—the mean, standard deviation, and percentiles—are the essential words in that story.
Finding the Center with the Mean
The first and most familiar concept is the mean, which is just the simple average of a measurement across a group. Let's say we measure the grip strength of 100 healthy 40-year-old men. The mean is what you get when you add up all their scores and divide by 100.
This average gives us a crucial central point of reference. It’s the "typical" score we can expect for someone in that demographic. So, if the mean grip strength for that group is 50 kg, we instantly know our patient’s 45 kg score is a little below the average for his peers.
The visual below really captures this idea, showing how we move from an isolated individual data point to understanding its place within a group average and the wider dataset.
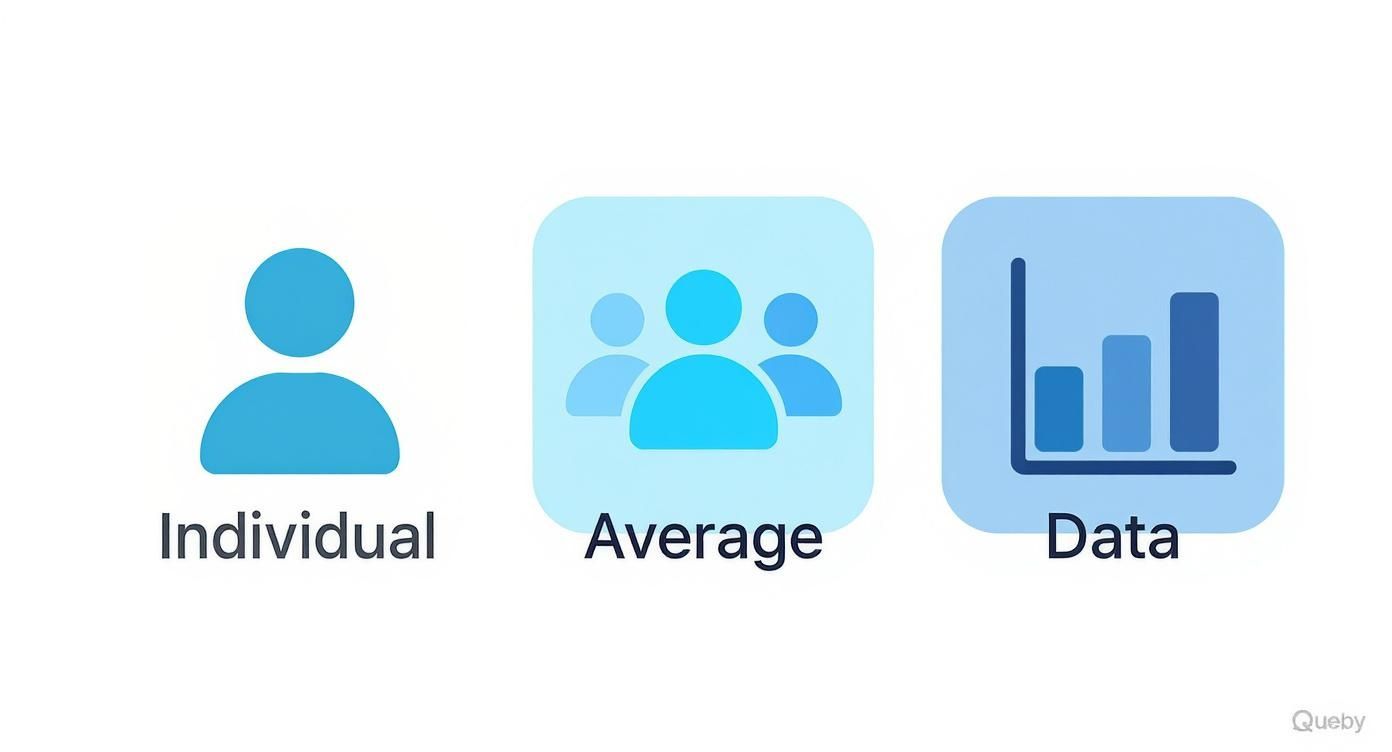
This comparison drives home the point: a measurement only becomes truly useful when it's contextualized against the performance of a relevant population.
Understanding the Spread with Standard Deviation
But just knowing the average isn't the whole picture. We also need to know how spread out the scores are. Are most men's scores clustered tightly around that 50 kg average, or is there a huge range of what's considered "normal" strength? This is where standard deviation (SD) comes into play.
Standard deviation measures how much the data points tend to stray from the mean.
- A small SD tells us most people in the group scored very close to the average. The data is consistent.
- A large SD indicates that scores are all over the place. The range of what's "normal" is much, much broader.
For us as practitioners, this context is everything. If the SD for grip strength is just 2 kg, our patient's 45 kg score (5 kg below the mean) looks like a pretty significant deviation. But if the SD is 10 kg, his score falls comfortably within the expected range. Good normative data relies on this stability, with research suggesting you need at least 85 unique participants to establish a scientifically sound mean and standard deviation (1).
Ranking Performance with Percentiles
While the mean and standard deviation lay the statistical groundwork, percentiles are what make this information incredibly easy to communicate. A percentile simply ranks an individual's score against everyone else in the dataset.
Key Takeaway: A percentile tells you the percentage of the population that an individual scored higher than. It boils a complex statistical position down to a simple, intuitive ranking from 1 to 99.
For instance, if our patient's 45 kg grip strength puts him in the 40th percentile, it means he performed better than 40% of the men in that reference group. This is a game-changer for patient communication.
Instead of getting bogged down in technical jargon like, "Your score is 1.2 standard deviations below the mean," you can frame it in a way that clicks: "Your strength is at the 40th percentile right now, and our goal is to get you to the 60th percentile over the next six weeks." This is clear, motivating, and sets a tangible target for both you and your patient. It's the final, crucial step in turning a number into a story of progress.
How a Reliable Normative Dataset Is Built
Great normative data doesn't just materialize out of thin air. It’s painstakingly built through a rigorous, almost obsessive, scientific process. Think of it like drafting a hyper-detailed map of human performance. If your initial survey points are off, the entire map becomes useless, leading anyone who relies on it way off course.
This journey from a collection of individual measurements to a dataset you can actually trust involves careful planning, consistent execution, and bulletproof validation. Every step is designed to ensure the final numbers are a true and fair reflection of the population they claim to represent. It’s this foundational work that gives us, as clinicians, the confidence to use these benchmarks in our day-to-day practice.
Recruiting the Right Participants
It all starts with getting the right people in the room. This is probably the most critical step. The goal is to build what’s known as a representative sample—a group whose makeup (think age, gender, activity level) perfectly mirrors the larger population you’re trying to understand.
You can't just grab data from whoever is available and call it a day. That’s a recipe for skewed results. Instead, researchers use specific strategies to weed out bias and ensure the sample is a true cross-section.
- Random Sampling: This is the gold standard. It gives every single person in the target population an equal chance of being selected. It’s like drawing names from a massive hat, preventing any one subgroup from dominating the results and distorting the average.
- Stratification: This is a more targeted approach. Researchers will often slice the population into key subgroups (or strata), like different age brackets or specific roles on a sports team. They then deliberately recruit participants from each of these slices to make sure the final sample is diverse and balanced.
Without this level of care in recruitment, the "average" you end up with isn't really an average at all. It becomes a flawed benchmark for any real-world clinical comparisons.
Standardizing the Measurement Process
Once you have the right group of people, the next hurdle is making sure every single measurement is taken in exactly the same way. Consistency is everything here. If one researcher tests an athlete’s jump height after a full warm-up and another tests them cold, the data is basically garbage.
To avoid this, solid research studies rely on strict, non-negotiable standardized protocols. These aren't just loose guidelines; they are precise, step-by-step instructions for everything—from how equipment is calibrated and how the patient is positioned, right down to the exact verbal cues given during the test.
This obsession with detail ensures high inter-rater reliability, which is a fancy way of saying different testers can get the same results under the same conditions. This level of standardization is a non-negotiable part of effective physical performance testing and is what makes the resulting norms valid. It’s what separates a real, scientific dataset from just a casual list of numbers.
Validating the Final Dataset
The final quality-control checkpoint is validation. After all the data is collected and analyzed, researchers have to triple-check that it’s accurate, reliable, and actually useful in a clinical setting. This means cross-referencing their findings with existing research and running a battery of statistical tests to make sure the dataset holds up under scrutiny.
For example, when we look at something like goniometric measurements for joint range of motion, the normative data we rely on comes from multiple studies that define a "typical" range. This allows us to spot deviations that might signal a problem. Ultimately, this lets clinicians see if an individual's measurement falls within the expected range, which is usually defined by a 95% confidence interval.
The Scientific Benchmark: How many people are enough? Some studies suggest a sample size of at least 85 participants is needed to generate stable means and standard deviations. This ensures that adding a few more data points won’t drastically change the core statistics, making the dataset a rock-solid benchmark for comparison (1).
Only after a dataset has been put through this gauntlet—rigorous recruitment, obsessive standardization, and thorough validation—can it be considered a trustworthy source of normative data. This deep commitment to the scientific method is what transforms raw numbers into a powerful tool for objective assessment and truly evidence-based care.
Applying Normative Data in Clinical Practice
It's one thing to understand the statistics behind normative data, but it's another thing entirely to see it in action on the treatment table. This is where the academic concept becomes a powerful, practical tool that guides critical decisions in physiotherapy, rehabilitation, and performance coaching every single day.
When you use a digital goniometer to measure a patient's knee flexion, the number on the screen is just the starting point. The real clinical insight comes when you compare that measurement to established normative data for the patient's age, gender, and activity level. That comparison gives you the objective context you need to build an effective treatment plan.
This isn’t a new idea. Its importance in medicine has been recognized for decades. Peer-reviewed research has long highlighted how essential normative data is for describing the natural history of clinical conditions, developing standards of care, and even defining how we classify illnesses (1). Without these datasets, clinicians would lack the benchmarks to accurately interpret whether a patient's values are healthy or signal a potential problem.
Setting Objective and Achievable Goals
One of the most immediate ways to use normative data is in goal setting, especially in post-op rehab. Picture an athlete six months after an anterior cruciate ligament (ACL) reconstruction. Their goal is to return to sport, but simply "getting stronger" is vague and doesn't give them a clear target.
This is where normative data for knee extension strength, measured with a digital dynamometer, becomes invaluable. By comparing her current strength output to percentile rankings for her sport and position, a physiotherapist can set specific, data-driven milestones.
- Initial Goal: Achieve strength equivalent to the 50th percentile for her demographic within the next eight weeks.
- Intermediate Goal: Reduce the strength asymmetry between her surgical and non-surgical legs to less than 10%—a common benchmark for return-to-play readiness.
- Final Goal: Reach the 80th percentile or higher to ensure she has a protective buffer against re-injury.
This approach takes the guesswork out of the equation. It replaces "let's see how you feel" with a clear, measurable roadmap that motivates the athlete and justifies the treatment plan to coaches and insurance providers.
Clinical Insight: Normative data allows practitioners to manage patient expectations effectively. By showing a patient where they are on a population "map," you can illustrate the journey ahead in clear, understandable terms, fostering trust and adherence to the plan.
Enhancing Diagnostic Accuracy
Normative data also sharpens our diagnostic accuracy. Consider a patient who comes in with shoulder pain and limited movement. A physical exam gives you clues, but comparing their active and passive range of motion to population averages adds a crucial layer of objective evidence.
If a 45-year-old office worker has only 140 degrees of shoulder flexion, and you know the normative data shows the average for his age group is 170-180 degrees, this significant deviation points more strongly toward a diagnosis like adhesive capsulitis or a rotator cuff issue. In this context, the definition of normative data is a tool for quantifying deficits.
It's the same for functional tests. The Sit to Stand test, a great measure of lower body strength and mobility, is a perfect example. Knowing the expected number of repetitions for a healthy 70-year-old allows a therapist to quickly identify fall risk or deconditioning. You can dig into the specifics in our guide to Sit to Stand test norms and see how useful they are in the clinic.
Communicating Progress and Justifying Care
Finally, normative data is a fantastic communication tool. The various clinical scenarios below illustrate just how versatile these benchmarks can be.
Clinical Applications of Normative Data in Rehabilitation
| Clinical Scenario | Measurement Tool | How Normative Data Is Used |
|---|---|---|
| ACL Reconstruction Rehab | Digital Dynamometer | Set progressive strength goals (e.g., reach 50th percentile) and verify return-to-play readiness by comparing limb symmetry to <10% asymmetry benchmarks. |
| Geriatric Fall Prevention | Timed Up and Go (TUG) Test | Compare a patient’s TUG time to age- and gender-specific norms to quickly identify individuals at a high risk for falls and initiate preventative care. |
| Post-Stroke Shoulder Recovery | Digital Goniometer | Track improvements in shoulder range of motion against normative values to quantify deficits, monitor recovery progress, and adjust therapy intensity. |
| Pediatric Developmental Screening | Grip Strength Dynamometer | Assess a child’s grip strength against age-matched percentile charts to identify potential developmental delays or neuromuscular conditions early on. |
| Return-to-Work Assessment | Functional Capacity Evaluation (FCE) | Compare a worker’s lifting, carrying, and pushing capacity to normative data for their specific job role to make objective decisions about their readiness to return safely. |
As you can see, the applications are broad and impactful. Showing a patient a graph where their performance has moved from the 20th percentile to the 60th percentile over a few months is far more powerful than just saying, "you're getting better."
This objective proof of progress accomplishes a few key things:
- Motivates Patients: It provides tangible evidence that their hard work is paying off.
- Justifies Treatment: It offers clear documentation for insurance claims and reports to referring physicians.
- Standardizes Care: It ensures that progress is measured against a consistent, evidence-based standard, not just a therapist's subjective opinion.
By building these benchmarks into your daily practice, you can elevate your standard of care, turning raw measurements into a clear narrative of recovery and performance improvement.
Limitations and Considerations for Using Normative Data
Normative data provides a powerful, objective compass for making clinical decisions. However, a compass only points north; it doesn’t reveal the steep hills or unexpected rivers you'll encounter on the journey. A common pitfall is treating these benchmarks as rigid, unchangeable rules. The art of evidence-based practice lies in blending these numbers with sharp clinical reasoning and a deep understanding of the individual in front of you. Relying solely on population averages can lead to setting inappropriate goals or misinterpreting progress.
Mismatched Populations: The Athlete vs. The Average
The specificity of the dataset is arguably the most critical factor. Normative data sourced from the general public is often not applicable—and may even be misleading—when assessing an elite athlete. An athlete's "normal" often lies well beyond the 99th percentile of a more sedentary population.
For example, a professional footballer's hamstring strength norms should be derived from a dataset of other elite footballers, not a sample of weekend joggers or office workers. Applying general population data in this context could lead to a dangerous underestimation of the strength required to return to play, potentially increasing the risk of re-injury. The value of normative data diminishes if the reference group isn't a true reflection of the individual being assessed. This is precisely why many practitioners build their own internal datasets over time, creating benchmarks perfectly suited to the unique demands of their specific athletic population (1).
The Shifting Sands of Norms: The Epoch Effect
Population norms are not static; they evolve over time. This phenomenon, sometimes called the epoch effect, means that data collected decades ago may not be relevant today. Significant shifts in lifestyle, nutrition, and training methods can alter population-wide metrics like strength, height, or mobility.
A Critical Question: Before relying on a normative dataset, always ask, "When was this data collected?" If the study is from the 1980s, its relevance today must be carefully considered. The when is just as important as the how.
This is why ongoing research is so vital. New studies help update our "maps of normal," ensuring the benchmarks we use reflect the current population, not a snapshot from a bygone era.
The Danger of Over-Interpreting Small Deviations
It’s also easy to become overly focused on minor deviations from the mean. Human biology is inherently variable. Falling slightly below the 50th percentile for a single measurement is not automatically a cause for concern. A value even one standard deviation away from the average can still be well within a perfectly healthy range.
The real clinical value comes from a more nuanced analysis:
- Spotting large deviations: Focus on scores that are significantly outside the typical range, such as more than two standard deviations from the mean.
- Tracking changes over time: An individual's data trend over weeks or months is often more insightful than a single comparison to a population.
- Seeing the full clinical picture: The objective number is just one piece of the puzzle. It must be integrated with the client’s subjective report, functional assessments, and specific goals.
Ultimately, normative data should be seen as a guide, not a verdict. Its true power is unlocked when a skilled clinician blends objective benchmarks with nuanced clinical expertise. The numbers provide invaluable context, but it’s clinical judgment that creates a truly personalized and effective plan.
Integrating Normative Data with Modern Measurement Tools
Technology has revolutionized the use of normative data, moving it from academic papers directly into the hands of practitioners. This synergy between modern digital tools and robust datasets is closing the gap between simply measuring a metric and truly understanding its meaning, making objective assessment faster and more accessible than ever.

Today’s software, often paired with devices like digital dynamometers and force plates, can instantly compare a client’s live measurement against massive population datasets. This gives you objective, real-time feedback on deficits and progress, turning every assessment into an immediate learning opportunity for both you and your client.
From Raw Numbers to Instant Insights
The real advantage is immediacy. A measurement is no longer just a number to be analyzed later. Modern tools deliver instant context, automatically calculating and displaying percentile ranks or z-scores right on the screen.
This streamlines the assessment process entirely. A physiotherapist can measure an athlete’s peak force output and, within seconds, show them exactly how they stack up against benchmarks for their sport, age, and position. This data-driven feedback is incredibly engaging and helps build strong buy-in for the rehabilitation plan. You can explore some of the range of motion measurement tools that are making this possible today.
The Power of Real-Time Comparison: When a client sees their performance plotted on a graph against normative data, their progress becomes tangible. That visual proof of improvement is a huge motivator, helping them stay engaged and stick with their program.
Elevating the Standard of Clinical Care
By bringing these technologies into your practice, you can sharpen your measurement accuracy and deliver more powerful insights that empower everyone involved. This integration lifts the standard of care in a few key ways:
- Improved Objectivity: It removes the guesswork from assessments like manual muscle testing and range of motion.
- Enhanced Efficiency: Instant analysis frees up valuable time, allowing you to focus more on treatment and less on crunching numbers.
- Greater Consistency: Standardized digital protocols ensure your measurements are repeatable and reliable, regardless of who takes them or when.
Ultimately, combining modern measurement tools with a solid grasp of the definition of normative data creates a much more dynamic and effective clinical environment. It provides the hard evidence needed to justify treatment plans, track outcomes with precision, and communicate progress in a way that truly connects with your clients.
Frequently Asked Questions About Normative Data
When you're navigating the world of rehabilitation and performance, you'll hear a lot of talk about data. But what does it all mean? Understanding the fundamentals of normative data is the key to making sense of clinical results and appreciating the evidence behind your treatment plan.
Let's break down some of the most common questions in a straightforward way.
What Is the Core Definition of Normative Data?
Put simply, normative data is a set of reference values showing the typical performance of a specific group of people. Think of it as creating a statistical "map of normal" for things like strength, flexibility, or balance.
This map is built by testing a large, representative sample—say, healthy adults between 30-40 years old—to establish what a typical baseline looks like. This gives a clinician immediate context, allowing them to see how an individual’s measurement compares to their peers, which is crucial for accurate diagnosis and setting meaningful goals.
Why Can't I Just Compare Myself to an Elite Athlete?
Comparing your numbers to the wrong group is a classic mistake. It's not just misleading; it can be completely counterproductive. Normative data is only useful when the reference group is actually relevant to you.
An elite athlete's "normal" is often way beyond the 99th percentile for the general population. Using their benchmarks could lead to wildly unrealistic goals or, even worse, a dangerously inaccurate assessment of whether you're ready to return to activity. Good practice always means comparing apples to apples, using norms from a similar demographic based on factors like:
- Age and Gender: Strength and mobility profiles change dramatically across our lifespan.
- Activity Level: The physical capacity of a sedentary person is vastly different from that of a weekend warrior or a competitive athlete.
- Sport-Specific Demands: A swimmer’s shoulder strength norms will look nothing like a powerlifter’s.
How Many People Are Needed for a Good Dataset?
Building a reliable normative dataset isn't just about collecting a bunch of numbers; it's a meticulous scientific process. While there's no single magic number, the research literature suggests that you generally need a sample size of at least 85 participants to generate stable, trustworthy means and standard deviations (1).
This ensures that the statistical averages won't wobble every time a few more people are added, making the dataset a rock-solid benchmark for clinical use.
A larger, more diverse sample size increases the "resolution" of the data, much like a camera with more pixels creates a clearer image. This gives us a far more accurate and reliable picture of a population's true range of performance.
This rigorous approach is what separates scientifically validated norms from a random list of scores. It guarantees the benchmarks we use in the clinic are robust, representative, and built on a solid, evidence-based foundation.
References
- Wright JG. Evaluating the outcome of treatment. Shouldn't we be using a reference group? J Clin Epidemiol. 2000 Jun;53(6):557-61.
At Meloq, we build digital measurement tools that bring this kind of objectivity directly into your practice. Our devices help you seamlessly compare your patients' data against evidence-based benchmarks, turning every assessment into a clear, actionable insight. See how you can elevate your clinical decisions at https://www.meloqdevices.com.

Featured Product
EasyForce Digital Dynamometer
Handheld muscle strength testing with 99% accuracy. Used in 40+ peer-reviewed studies.
Learn More