
Definition of Normative Data: A Clinician's Guide to Using Norms Effectively
Team Meloq
Author
In physiotherapy and sports performance, normative data can be understood as a high-quality reference map. It is a collection of benchmarks from a large, representative population, allowing clinicians to transform subjective observations into objective, data-backed insights. These reference values are crucial for evaluating patient status, setting realistic goals, and tracking progress with scientific rigour (1).
What Is Normative Data in Clinical Practice?
Imagine assessing an athlete's recovery without a clear picture of what "100%" represents for someone of their age, sex, and sport. Normative data provides this essential context. It functions like a 'performance growth chart' for physical abilities, showing precisely how an individual’s measurements compare against their peers.

The concept is not new; it has been a cornerstone of medicine and psychometrics since the mid-20th century. Researchers began establishing standards to describe "typical" values within a given population. These reference values create baseline distributions—such as means, standard deviations, and percentiles—that are still fundamental for interpreting individual test scores today (2).
The Power of Objective Comparison
Instead of relying on clinical intuition alone, normative data allows clinicians to answer critical questions with greater confidence.
- Is a patient’s range of motion truly limited? Comparing their goniometer reading to established norms for their demographic provides a clear, objective answer.
- How significant is a strength deficit after surgery? Placing dynamometry results against population data reveals the true extent of weakness, guiding rehabilitation intensity.
- Is an athlete ready to return to play? Force plate metrics, when measured against benchmarks for their specific sport, offer an evidence-based foundation for making this crucial decision (3).
This process removes subjectivity and establishes a shared, understandable language for tracking progress. A similar principle is used in other healthcare fields; for example, a comprehensive adult ADHD assessment uses normative data to help diagnose conditions by comparing an individual's cognitive profile to established population norms.
To clarify these concepts, here is a simple breakdown.
Key Components of Normative Data at a Glance
| Component | What It Means in Simple Terms | Why It Matters for Clinicians |
|---|---|---|
| Representative Sample | The group of people the data was collected from. It should mirror your patient (age, sex, activity level). | An unmatched sample makes the comparison invalid. It’s like comparing a marathon runner's VO2 max to a powerlifter's (4). |
| Standardized Testing | Everyone in the sample was measured the exact same way, with the same tools and procedures. | Ensures the data is reliable and consistent. Without it, you can't trust the numbers mean the same thing from person to person. |
| Statistical Measures | The numbers that describe the group, like the average (mean), spread (standard deviation), and rankings (percentiles). | These statistics allow you to pinpoint exactly where your patient falls within the group—are they average, below average, or exceptional? |
| Demographic Breakdown | The data is sorted into specific subgroups (e.g., male athletes aged 18-24). | This allows for highly specific and relevant comparisons, making your assessments far more accurate and clinically useful. |
The value of normative data lies in the context it provides. It transforms a single number—like a strength measurement—from an isolated data point into a meaningful piece of clinical evidence that guides goal-setting and treatment planning.
By understanding these population-level benchmarks, you can set realistic recovery targets and demonstrate measurable progress to your patients. This objective approach is empowering for both the clinician and the individual undergoing rehabilitation.
How Normative Data Is Collected and Verified
Trustworthy normative data is the product of a meticulous, scientific process designed to ensure that the benchmarks used for critical clinical decisions are both valid and reliable. The foundational step in this process is sampling.
This is analogous to a well-conducted scientific study. Researchers cannot test every individual in a target group, so they select a smaller, representative sample whose data can be generalised to the entire population. The process begins by defining a specific target population—for example, elite female volleyball players between the ages of 18 and 22.
Next, a representative sample must be drawn from that group. This smaller group must mirror the key characteristics of the larger population for the data to be useful. If the sample is skewed—for instance, including only players from a single team or region—the resulting data will not be a true reflection of the entire population, introducing bias (5).
The Science of Sampling
Constructing a valid sample requires careful consideration of several factors. Each one significantly influences the quality and applicability of the final dataset.
- Age: The physiological norms for a 55-year-old are vastly different from those of a 20-year-old.
- Sex: Biological differences often lead to distinct performance norms between males and females in many physical tests (6).
- Activity Level: Comparing a sedentary individual to a professional athlete would be a fundamental error in clinical reasoning.
- Sport Specificity: The strength and power profile of a swimmer is entirely different from that of a powerlifter.
The goal is to build a dataset so specific that when you compare your patient's results, you can be confident the comparison is fair and meaningful. A mismatch in any of these key demographics can render the data misleading.
How Big Does a Sample Need to Be?
The optimal sample size is a frequent topic of discussion. For broad population norms, datasets often include hundreds or even thousands of participants to ensure robustness.
However, for more specific clinical measures, the requirements can differ. Some researchers suggest that carefully collected samples of 30–40 participants can yield reasonably reliable data for specific, homogenous groups (7). For further reading on how sample size affects data confidence, you can exploring expert opinions on normative databases.
Once the sample is defined, every participant must be tested using identical, standardized procedures and calibrated instruments. This rigour ensures consistency and reliability across all measurements. To learn more about the tools involved, our guide on what force measurement involves in a clinical setting may be useful. This strict methodology is what transforms raw numbers into a verified, trustworthy resource for objective clinical assessment.
Translating Numbers into Clinical Insights
Raw data from a strength or mobility test is merely a collection of numbers. To become meaningful, this data requires context. Key statistical concepts provide this context, turning figures into a clear narrative about a patient's functional status.
The most fundamental concept is the mean, or the average score for the population sample. This gives us a central point of reference for what is "typical" in that group. However, individuals naturally vary, and this spread of results around the mean is also important.
The standard deviation (SD) measures this spread. A small SD indicates that most scores are clustered closely around the average, while a large SD signifies a wider range of results. The SD is crucial for understanding how significantly an individual's score deviates from the norm.
Percentiles: A Practical Ranking System
Percentiles offer a powerful and intuitive way to interpret scores. A percentile rank indicates the percentage of the population that scored below a specific individual. It provides a direct comparison of where someone stands relative to their peers.
- Example: A 20th Percentile Score. If a patient's post-operative knee extension strength is at the 20th percentile, it means their performance was better than 20% of the comparable population, while 80% of that population performed better. This immediately highlights a significant deficit requiring attention.
- Example: An 85th Percentile Score. Conversely, if an athlete scores at the 85th percentile on a vertical jump test, they are outperforming 85% of their peers. This indicates an area of exceptional strength or power.
This ranking system helps communicate outcomes clearly to patients, making progress tangible and goals easier to understand. It is a vital component of effective outcome measurement in rehabilitation because it quantifies performance in a universally understandable way.
The following graphic outlines the basic process for creating the data that these statistical tools help interpret.
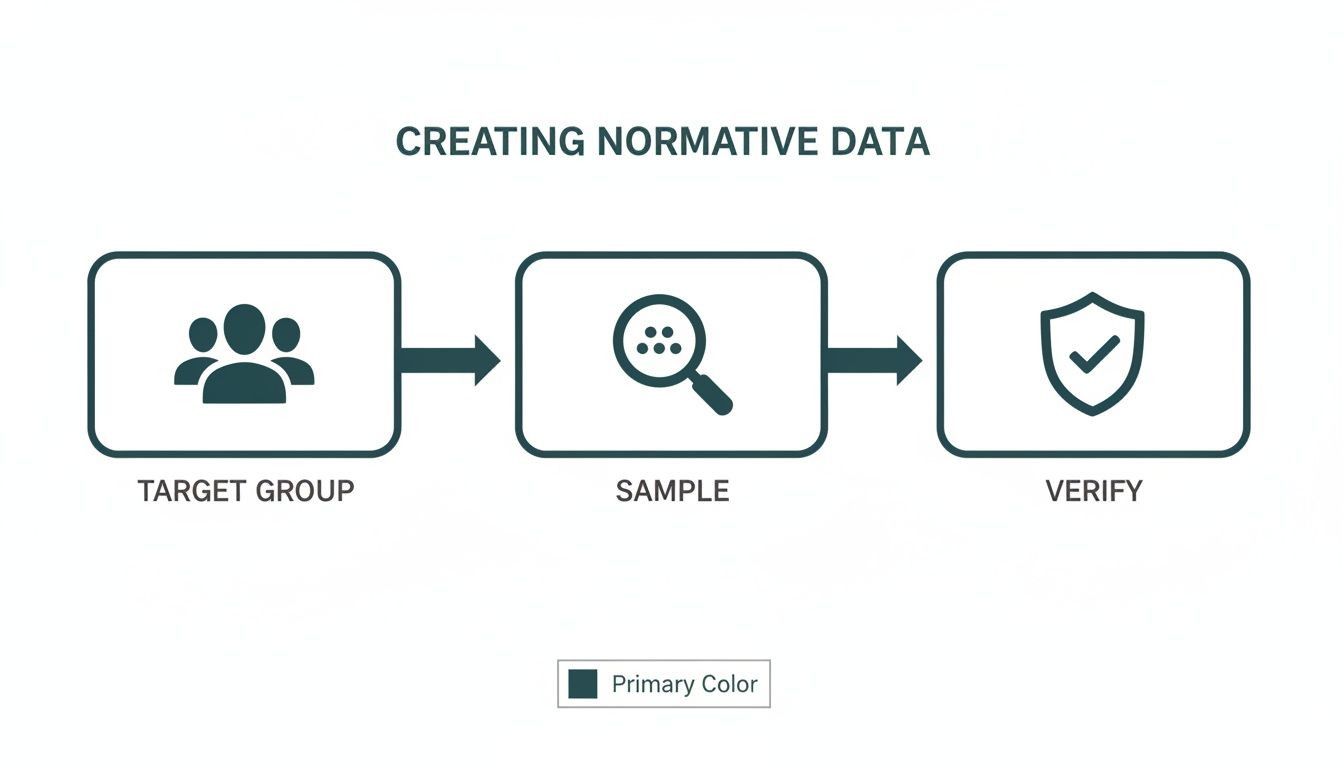
As shown, reliable data begins with identifying a specific target group, collecting a representative sample, and meticulously verifying the results.
Using Standard Deviations to Spot Significant Differences
Standard deviations provide another lens for interpretation. A common clinical practice is to flag scores falling significantly outside the norm, often defined as being more than one or two standard deviations from the mean.
If a patient’s quadriceps strength is -2 standard deviations below the mean for their demographic, it is a statistical red flag. In a normal distribution, approximately 95% of all scores fall within two standard deviations of the average. A score beyond this range is highly atypical and likely indicates a clinically significant issue (8).
This statistical approach moves beyond simple averages, allowing you to identify both subtle and substantial deviations with confidence. By mastering these concepts, you can transform raw measurements into powerful clinical insights, helping you pinpoint deficits, celebrate progress, and communicate patient outcomes with objective clarity.
Putting Normative Data to Work in Your Practice
The true value of normative data is realised in clinical application, where statistics inform tangible, patient-centred decisions. By comparing a patient’s measurements to established norms, you can identify deficits, set meaningful goals, and demonstrate clear evidence of progress.
This process is straightforward. Whether using a goniometer for range of motion, a handheld dynamometer for strength, or a force plate for power, each measurement gains significant value when contextualised against a relevant benchmark. The assessment is elevated from a simple observation to an evidence-based conclusion.

This data-informed approach also allows you to provide objective proof of progress to patients, insurers, and other healthcare professionals, strengthening your clinical reasoning and building trust.
Common Clinical Applications
Let’s examine how this works in common scenarios. Each example illustrates how comparing an individual to a peer group shapes the entire rehabilitation journey.
-
ACL Rehabilitation: An athlete is six months post-ACL reconstruction. Using a dynamometer, you measure their quadriceps strength and find it is at the 35th percentile for their age, sex, and sport. This single number immediately flags a significant deficit and provides a quantifiable starting point for a targeted strengthening programme (9).
-
Fall Risk in Older Adults: An elderly patient expresses fear of falling. You can administer a functional test like the Sit to Stand test, which has well-established norms. If their performance is -1.5 standard deviations below the mean for their age group, you have concrete evidence of reduced functional strength, justifying a specific balance and power intervention. For a deeper dive, review our guide on Sit to Stand test norms.
-
Return to Sport Testing: A footballer recovering from an ankle sprain is eager to return to play. A force plate can assess their single-leg jump height and reactive strength. By comparing data to normal ranges for collegiate soccer players, you can determine if they have regained the explosive power needed to compete safely, helping to prevent re-injury (10).
From Data to Decisions
In each of these cases, normative data provides the crucial context. Without it, a strength reading or jump height is just an isolated number. With it, that number becomes a powerful tool for making informed clinical decisions.
To give you a clearer picture, here’s a quick breakdown of how this works with some of the tools you might have in your clinic.
Clinical Tools and Their Normative Data Applications
The table below summarizes how common assessment tools are paired with normative data to guide clinical decisions.
| Clinical Tool | What It Measures | How Normative Data Guides Decisions |
|---|---|---|
| Goniometer | Joint range of motion (ROM) in degrees | Compares a patient's ROM to age and sex norms to identify limitations and set mobility goals. |
| Handheld Dynamometer | Isometric muscle strength in pounds or Newtons | Benchmarks strength against peer data to quantify deficits and track progress in strength training programs. |
| Force Plate | Ground reaction forces, power, and balance | Assesses jump height or balance against sport-specific norms to guide return-to-play decisions. |
| Functional Tests | Timed performance on tasks (e.g., TUG, STS) | Compares test times to age-matched norms to assess functional mobility and fall risk. |
This systematic approach reduces guesswork in rehabilitation, replacing it with objective, defensible reasoning.
The core idea is to move beyond subjective feelings of "better" or "stronger." Normative data lets you say, "Your quadriceps strength has improved from the 35th to the 60th percentile, bringing you much closer to the average for your peers and significantly reducing your re-injury risk."
This kind of objective feedback is highly motivating for patients and provides a solid foundation for your treatment plans. It transforms your clinical practice from one based on observation to one driven by clear, compelling evidence.
Avoiding Common Pitfalls and Biases
Using inappropriate normative data can be more detrimental than using no data at all. To apply these benchmarks ethically and effectively, clinicians must be critical consumers of information. The goal is to ensure every clinical comparison is fair, accurate, and truly centred on the individual.
The most critical error is using mismatched norms.
Imagine comparing the grip strength of a 75-year-old woman recovering from a stroke to a dataset of 25-year-old male rock climbers. The comparison is absurd, yet more subtle versions of this mistake can occur. For instance, comparing a recreational athlete to data from professionals sets an unrealistic and demotivating standard. A deep understanding of a dataset’s origin is non-negotiable for any clinician using normative data.
Scrutinizing the Source
Before trusting any dataset, it is essential to identify potential biases. A dataset might be statistically sound but practically useless if it does not reflect your patient. The use and misuse of normative data have real impacts on patient outcomes.
For example, research in neuropsychology demonstrates that certain populations may perform substantially differently than general population norms. Applying standard norms inappropriately can lead to inaccurate conclusions about impairment levels. You can read more about how mismatched norms affect assessments to understand the real-world consequences.
To avoid these errors, ask these critical questions before applying any normative data:
- Who was in the sample? Examine the demographics: age, sex, activity level, and specific sport or condition.
- When was the data collected? Performance standards can change over time. A dataset from the 1980s might not accurately reflect today's populations.
- How was the data collected? Ensure the testing protocol—equipment, procedure, instructions—matches your own. Different methods can produce different results, invalidating the comparison (11).
- Does this reflect my patient's reality? This is the ultimate test. If the data does not represent the person in front of you, find a better source or consider developing internal benchmarks.
Patient-centred care demands that we see individuals, not just numbers. Normative data is a tool to enhance clinical judgment, not replace it. Your expertise translates a percentile rank into a meaningful, compassionate, and effective treatment plan.
By approaching normative data with healthy skepticism and a commitment to relevance, you ensure your assessments are not only data-driven but also genuinely fair. This diligence is a hallmark of excellent clinical practice.
Tying It All Together: A Framework for Smarter Assessments
This guide has provided the tools to shift from clinical guesswork to data-driven care. Normative data serves as the framework for turning subjective observations into objective, evidence-based assessments that patients and colleagues can understand.
By comparing your patient's performance to established benchmarks, you can pinpoint deficits with accuracy, track progress meaningfully, and set realistic goals with confidence. It adds a layer of scientific rigour to the clinical artistry you apply every day.
Your Four-Step Clinical Framework
To conclude, here is a practical framework for applying normative data responsibly:
- Define the Patient Context: Always begin here. Understand your patient's specific demographics, functional level, and personal circumstances.
- Source Reputable Data: Choose a well-matched dataset from high-quality, peer-reviewed research or trusted clinical sources.
- Interpret with Wisdom: This is where your expertise shines. Blend statistical scores with your clinical judgment; never let numbers overshadow the person.
- Set Collaborative Goals: Use the insights gathered to work with your patient to establish meaningful, achievable targets.
Adopting this structured approach is a powerful step toward delivering the highest standard of modern clinical care. It validates your expertise with objective evidence, building trust and paving the way for superior outcomes.
References
- Portney LG, Watkins MP. Foundations of Clinical Research: Applications to Practice. 3rd ed. Upper Saddle River, NJ: Pearson/Prentice Hall; 2009.
- Strauss E, Sherman EMS, Spreen O. A Compendium of Neuropsychological Tests: Administration, Norms, and Commentary. 3rd ed. New York: Oxford University Press; 2006.
- Myer GD, Paterno MV, Ford KR, Hewett TE. Neuromuscular training techniques to target deficits before return to sport after anterior cruciate ligament reconstruction. J Strength Cond Res. 2008;22(3):987-1014.
- Bartlett R, Gratton C. Research Methods in Youth Sport. London: Routledge; 2003.
- Hulley SB, Cummings SR, Browner WS, Grady DG, Newman TB. Designing Clinical Research. 4th ed. Philadelphia, PA: Lippincott Williams & Wilkins; 2013.
- Abe T, Loenneke JP. Handgrip strength and muscle mass in a large cohort of healthy men and women across the lifespan. Phys Sportsmed. 2018;46(3):362-367.
- Hertzog MA. Considerations in determining sample size for pilot studies. Res Nurs Health. 2008;31(2):180-191.
- Altman DG, Bland JM. Statistics notes: the normal distribution. BMJ. 1995;310(6975):298.
- Lentz TA, Paterno MV, Schmitt LC. The role of normative reference data in sports medicine. J Orthop Sports Phys Ther. 2015;45(10):734-736.
- Hewett TE, Myer GD, Ford KR, et al. Biomechanical measures of neuromuscular control and valgus loading of the knee predict anterior cruciate ligament injury risk in female athletes: a prospective study. Am J Sports Med. 2005;33(4):492-501.
- Dvir Z. Isokinetics: Muscle Testing, Interpretation and Clinical Applications. 2nd ed. Edinburgh: Churchill Livingstone; 2004.
At Meloq, we're focused on giving clinicians the accurate, portable tools needed to bring this data-driven framework to life. See how our digital goniometers, dynamometers, and force plates can help you quantify patient progress with precision.

Featured Product
EasyForce Digital Dynamometer
Handheld muscle strength testing with 99% accuracy. Used in 40+ peer-reviewed studies.
Learn More