
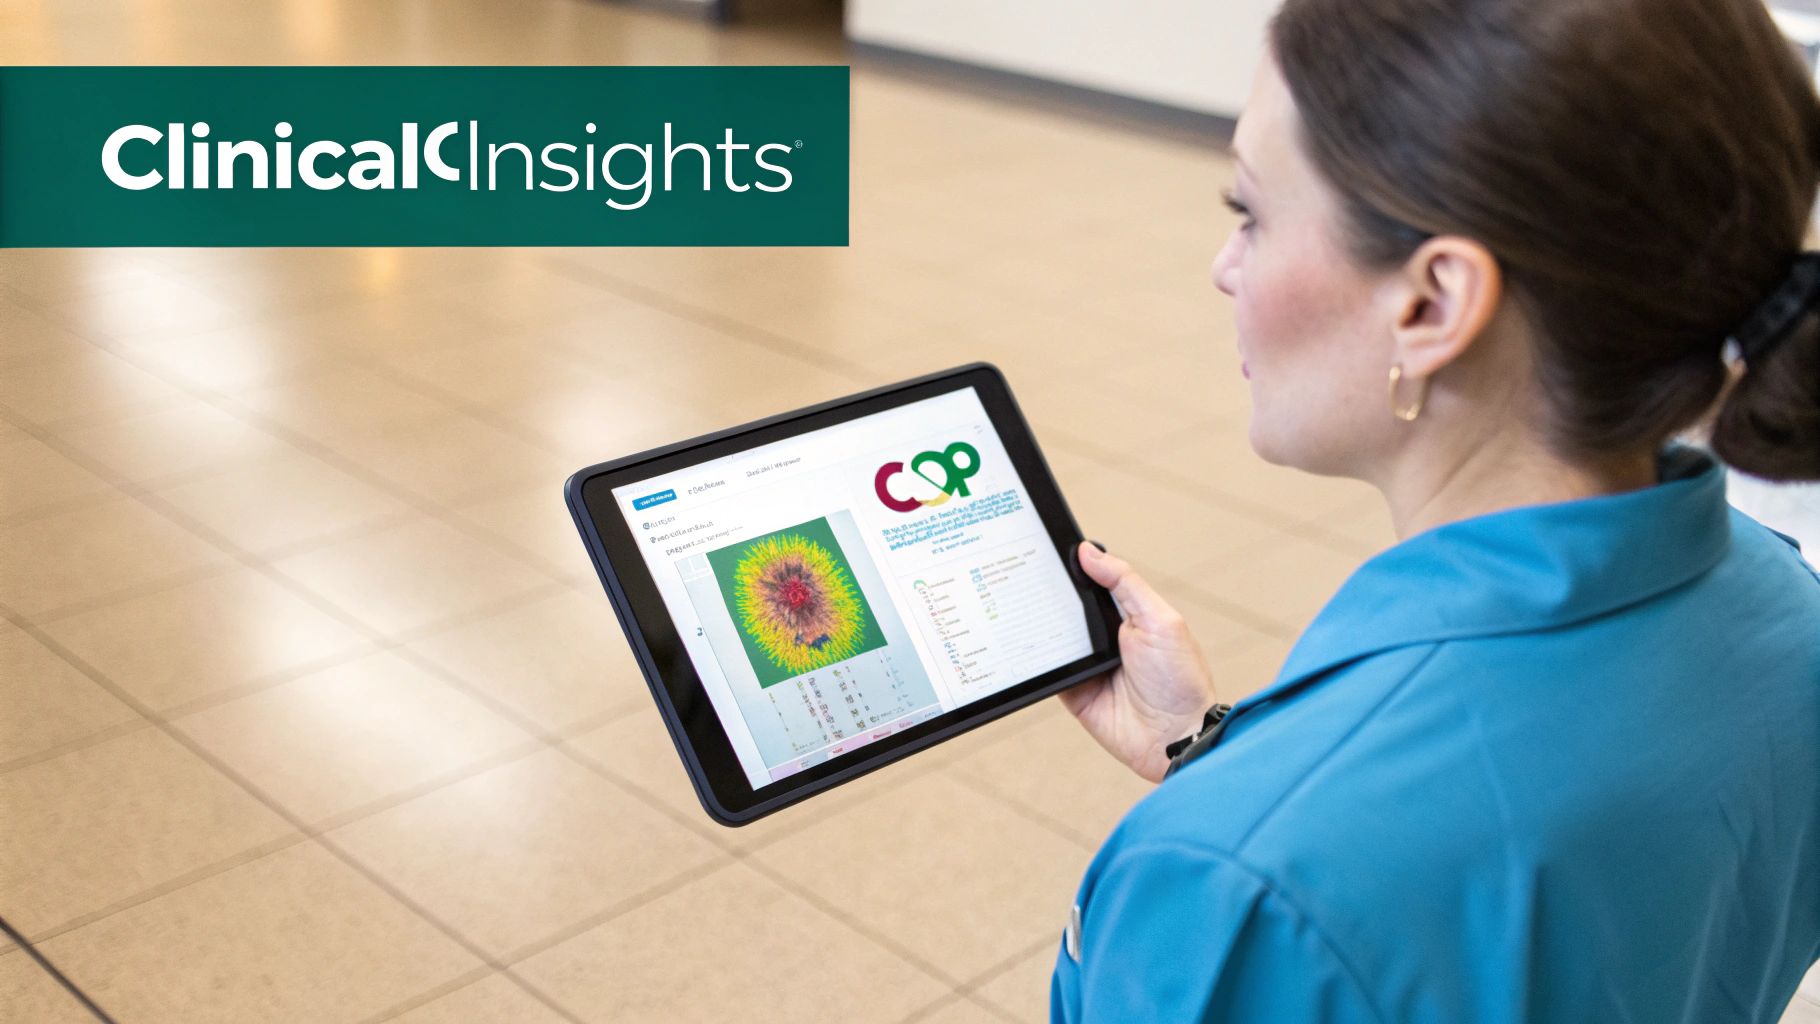
Mastering the Center of Pressure in Clinical Practice
Team Meloq
Author
The center of pressure (COP) is the exact point on a supportive surface where the total sum of all ground reaction forces acts. Think of it as the focal point of balance—a direct, measurable reflection of how well the body is maintaining postural control (1).
Decoding Your Body's Balancing Act
Ever tried to balance a full tray of drinks with one hand? You're constantly making tiny, almost unconscious adjustments to keep everything from crashing down. That single, shifting point on your palm where all the balancing forces meet is a practical example of the center of pressure. The concept is exactly the same when we talk about your feet on the ground.
This isn't just biomechanics theory; it's a direct window into your neuromuscular system's performance. Every subtle shift in the COP is the result of your brain instructing your muscles on how to stay upright. For clinicians and coaches, this transforms balance assessment from a subjective observation ("they look a little wobbly") into objective, hard data.
Center of Pressure (COP) vs Center of Mass (COM)
It is common to mix up the center of pressure (COP) and the center of mass (COM), but they tell two different—though related—parts of the stability story.
Simply put, your Center of Mass (COM) is your body's theoretical balance point. It's the averaged location of all your body's mass. If you were a statue, this point wouldn't move relative to your body's segments.
Your Center of Pressure (COP), on the other hand, is the point of force application on the ground. It has to constantly move around your COM to prevent you from falling over (2).
Here's a helpful table breaking down the key differences:
| Aspect | Center of Pressure (COP) | Center of Mass (COM) |
|---|---|---|
| What it is | The single point of ground reaction force application. | The averaged location of total body mass. |
| Location | On the supporting surface (e.g., the ground). | Inside the body; a theoretical point. |
| Behavior | Highly dynamic; moves continuously to maintain balance. | Moves less and more slowly than the COP. |
| Analogy | The end of the balancing pole on the tightrope. | The tightrope walker themselves. |
| Measurement | Measured directly with force plates or pressure mats. | Calculated or estimated from body segment data. |
Think of the COM as the tightrope walker and the COP as the end of their long balancing pole touching the rope. The end of that pole must constantly shift and adjust to keep the walker’s mass safely centered over the wire. The dynamic relationship between these two points is the key to understanding what static balance truly is and the incredible control your body exerts to maintain it.
This distinction is critical: The COM is an intrinsic property of the body's mass, while the COP is an extrinsic measure of how that mass interacts with a supportive surface. It is the neuromuscular system's reaction to the COM's position (2).
This difference is precisely what gives the COP its immense clinical value. By tracking the COP's movement—its sway—we can quantify the body's control strategies. A larger, faster, or more erratic COP path may signal a less stable system, perhaps due to injury, a neurological issue, or fatigue. For anyone in rehabilitation, this provides a precise way to monitor a patient's stability and track their recovery journey over time.
How We Measure and Visualize Postural Sway
To truly understand balance, you have to see it in action. Measuring the center of pressure is how we turn the invisible dance of postural control into hard data, showing us the subtle strategies our bodies use just to stay upright. This all comes down to specialized tools that capture the ground reaction forces under our feet with incredible precision.
The two main tools here are force plates and pressure mats. A force plate is essentially a high-tech scale that doesn't just measure total force, but also pinpoints the exact location of that force—the center of pressure. A pressure mat works a bit differently, using a grid of tiny sensors to create a detailed pressure map across the sole of the foot.
Both tools are incredibly fast, grabbing hundreds or thousands of data points every second. All this information is then used to create a visual map of balance known as a stabilogram, or COP path.
The Story Told by a Stabilogram
Picture this: you dip a pen in ink, attach it to the single balance point under your feet, and then stand still on a piece of paper for a set duration, such as 30 seconds. The scribble left behind—that seemingly random line—is a stabilogram. It’s a visual diary of your center of pressure's journey, and it's packed with information about your neuromuscular control.
This diagram helps clarify the difference between the body's internal balance point (Center of Mass) and how that balance is actually expressed on the ground (Center of Pressure).

This comparison really drives home the point: while the brain is busy managing the body’s mass, the feet are where the balancing act is performed and measured. By analyzing the COP's path, we can decode the body's stability strategies.
To make sense of this complex path, we break it down into simpler movements. The two most fundamental are:
- Mediolateral (ML) Sway: This is the side-to-side motion.
- Anterior-Posterior (AP) Sway: This is the front-to-back motion.
By looking at the amount and direction of sway, patterns start to emerge. For example, a person who sways mostly front-to-back is likely using an "ankle strategy," making fine adjustments with the muscles around their ankles. In contrast, larger, faster sway—especially side-to-side—might point to a "hip strategy," where the hips are recruited to correct bigger imbalances (3). You can learn more about how these forces are captured in our guide on the biomechanics of force platforms.
Why Quantifying Sway Is a Clinical Game Changer
In physical therapy, the center of pressure is a vital sign for postural stability, especially for older adults at risk of falling. Research has shown that postural sway, particularly in the side-to-side (ML) direction, tends to increase with age, which is associated with a decline in balance control (4). Given the significant healthcare costs associated with falls, COP analysis gives therapists a standardized way to assess risk and create targeted interventions.
Turning a subjective observation like "unsteadiness" into a hard number provides an objective baseline. This lets clinicians track progress, confirm that treatments are working, and make data-driven decisions with far greater confidence.
Ultimately, the ability to see and quantify postural sway takes the guesswork out of balance assessment. It gives professionals a clear, objective language to discuss a patient's stability and a powerful tool to guide them back to recovery or toward peak performance.
Translating COP Data Into Actionable Clinical Insights
Raw center of pressure data, fresh from a force plate, is a stream of coordinates. Its true power isn't unlocked until we interpret it, turning that data into a clear story about a patient's stability and neuromuscular control. Mastering the key metrics is the first step toward making confident, data-driven clinical decisions.
Think of it like this: the stabilogram is the map of the terrain, but the metrics are the legend. They tell you what all the lines, curves, and distances actually mean. Let's break down the most critical measurements and what they reveal about your patient.
COP Path Length
COP Path Length is the total distance the center of pressure travels during a test. Imagine it as the full length of the "scribble" our balance pencil makes. It’s a direct measure of how much corrective work the body is doing to stay upright.
A longer path length generally means the neuromuscular system is working harder to maintain stability. This could point to fatigue, a proprioceptive deficit, or an inefficient balance strategy. On the flip side, a very short path length usually signals a stable, efficient system that needs minimal correction (1).
Sway Area
If path length is the journey, then Sway Area is the territory it covers. This metric measures the total area enclosed by the COP's movement, often calculated as an ellipse containing 95% of the data points. It gives you a fantastic snapshot of a person's overall postural stability.
A large sway area implies looser balance control, with the COP wandering over a wide region. This may be seen in patients with neurological conditions or in older adults with a higher risk of falling. A smaller area, by contrast, indicates tighter, more effective control.
A key insight is that a patient can have a long path length but a small sway area. This pattern often suggests a high-frequency, low-amplitude control strategy—the body is making many small, rapid adjustments to stay within a tight boundary. It can be an effective, albeit energy-intensive, strategy.
Mean Velocity of Sway
Mean Velocity tells you how fast, on average, the center of pressure is moving. You calculate it by dividing the total path length by the test duration. This metric is all about the speed and efficiency of postural corrections.
High sway velocity can be a red flag. It may point to a reactive, almost "panicked," balance system that's constantly over-correcting. This is sometimes observed in individuals with vestibular issues or those recovering from a lower-limb injury who lack confidence in their balance. Lower velocity reflects smoother, more deliberate control.
Root Mean Square (RMS) of Displacement
Root Mean Square (RMS) of Displacement measures the average "wobble" distance of the COP from its central point. It gives a reliable measure of sway magnitude in both the front-to-back (anteroposterior, or AP) and side-to-side (mediolateral, or ML) directions.
Breaking down RMS by direction is incredibly useful. For instance, a high ML RMS might signal weakness in the hip abductors, a common issue after a stroke or hip surgery. High AP RMS could point to deficits in ankle plantarflexor or dorsiflexor control. Tracking these directional components helps clinicians pinpoint the source of instability with much greater accuracy.
Of course, comparing these numbers to established benchmarks is essential. That's why understanding the principles behind what normative data is is so crucial for effective interpretation.
To help you get started, here's a quick summary of what these core metrics tell you at a glance.
Essential COP Metrics and Their Clinical Meaning
This table breaks down the key metrics from COP analysis and what they might indicate about a patient's stability and motor control strategy.
| Metric | What It Measures | High Value Implies | Low Value Implies |
|---|---|---|---|
| Path Length | Total distance the COP travels | More corrective activity; potential instability or inefficiency. | Less corrective activity; efficient and stable control. |
| Sway Area | The 2D area covered by COP movement | Poor overall postural control; wide-ranging sway. | Tight postural control; minimal sway territory. |
| Mean Velocity | Average speed of the COP | Rapid, reactive, or over-corrective adjustments. | Smooth, controlled, and deliberate postural corrections. |
| RMS of Displacement | Average deviation from the center point | Greater sway magnitude; larger "wobble." | Smaller sway magnitude; better central stability. |
Think of this as your cheat sheet for turning complex data into a clear clinical picture, helping you move from measurement to meaningful intervention.
In dynamic balance assessments, COP velocity and displacement can be important indicators of fall risk. For example, during tests that challenge the limits of stability, some older adults may exhibit significantly higher COP velocities compared to younger, healthy individuals, which has been associated with an increased probability of falls (5).
For sports rehabilitation, asymmetries in COP metrics after an injury like an ACL reconstruction can be a concern. Some research suggests that significant asymmetries in postural control may be linked to a higher reinjury risk, highlighting the need for data-driven protocols to guide return-to-play decisions (6). This type of objective data has helped revolutionize clinical workflows by reducing assessment time while delivering standardized, reliable results. You can explore more insights on Physio-pedia).
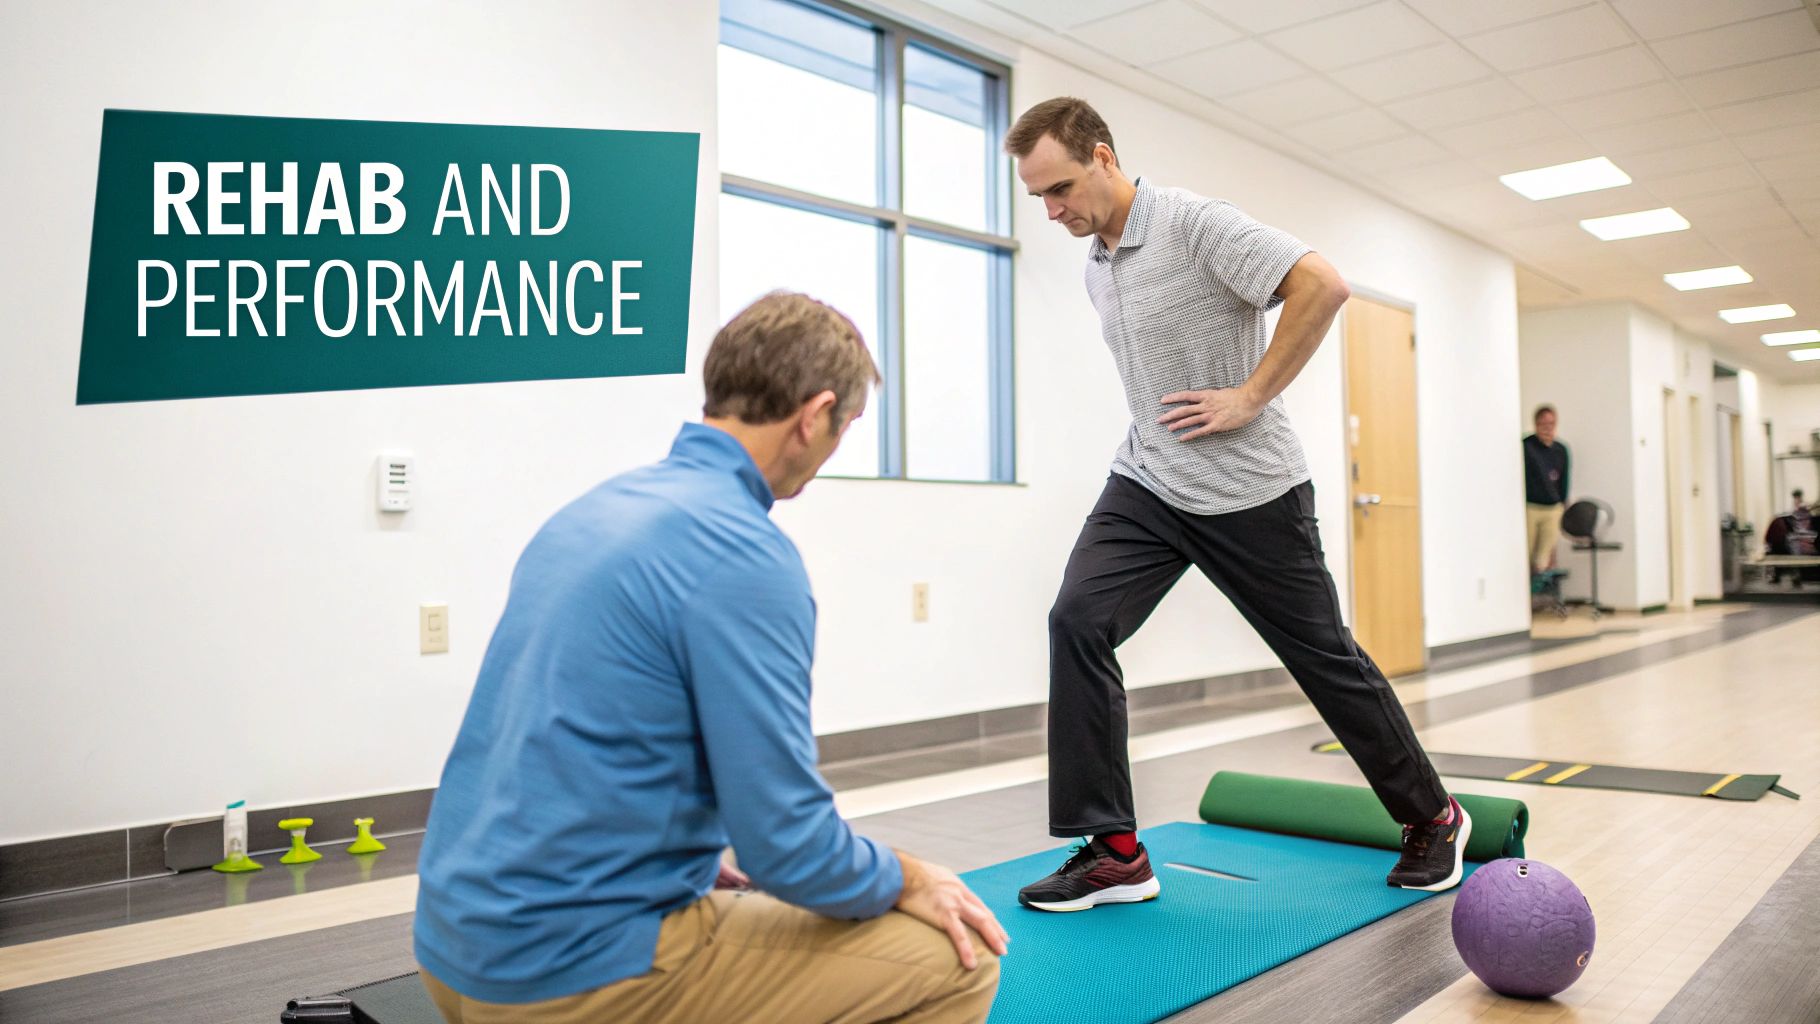
Applying COP Analysis in Rehabilitation and Performance
This is where the theory hits the clinic floor. The real impact happens when we translate raw center of pressure data into focused, effective interventions for our clients. By using objective COP metrics, we can craft truly personalized care plans.
Let's look at how this data shapes decision-making in a few real-world scenarios, from helping an older adult prevent falls to clearing an elite athlete for a safe return to sport.
Case Study: Fall Prevention in an Elderly Patient
Imagine an 82-year-old patient who has had two minor falls in the past six months. A physical therapist needs to quantify his fall risk and build a solid prevention program. Subjective observation suggests he's "unsteady," but objective data is needed to pinpoint exactly where his balance system is failing him.
The test is simple: a 30-second quiet stance on a force plate, first with eyes open, then with eyes closed. This classic protocol helps quickly isolate how much he relies on his visual, vestibular, and somatosensory systems to stay upright. You can get into the details of setting up this kind of assessment in our guide to force plate testing.
What the Data Tells Us: With his eyes open, the data shows a moderately large sway area. But the moment he closes his eyes, his sway area might increase significantly, and his mediolateral (side-to-side) sway velocity could double. This is a potential red flag. It suggests he may be heavily dependent on his vision for stability and has less effective proprioceptive and vestibular input.
Armed with this insight, the treatment plan becomes incredibly specific. Instead of just generic balance exercises, the therapist can prescribe drills that directly challenge his proprioceptive system—such as standing on foam pads or performing simple tasks with his eyes closed in a safe setting. The COP data gives us a clear baseline to track his progress and demonstrate that our interventions are working.
Case Study: ACL Post-Surgical Recovery
Next up, an orthopedic surgeon is six months post-op with a 22-year-old soccer player who had an ACL reconstruction. The big question: is she ready to start a return-to-play protocol? Simply observing her jog on a treadmill isn't enough; we need to know if her knee can handle the explosive, unpredictable movements of her sport.
For this, we would use a series of single-leg balance tests on a force plate, comparing her surgical leg directly to her non-surgical leg. This comparison is critical for spotting asymmetries that may increase the risk of re-injury.
What the Data Tells Us: The numbers reveal a potential imbalance. The COP path length on her surgical leg might be 40% longer than on her healthy side, which means her muscles are working overtime just to keep her stable. Her sway area on the affected leg could also be much larger, a clear sign of poorer control and a lack of confidence in the joint.
This objective data gives us a powerful, evidence-based reason to adjust her return-to-play progression. Research has linked significant post-ACL COP asymmetry with a higher risk of re-injury (6). With this information, the surgeon and physical therapist can tailor her rehab to focus on single-leg stability and neuromuscular control, re-testing periodically until that asymmetry is minimized.
Case Study: Concussion Return-to-Play Protocol
Finally, a sports coach is evaluating a 19-year-old football player after a concussion. He’s passed his cognitive tests, but balance is an incredibly sensitive marker for subtle, lingering neurological issues. These postural control deficits can persist long after other symptoms have cleared up.
A common protocol here is a tandem (heel-to-toe) or single-leg stance on a force plate, often paired with a cognitive task like counting backward by sevens. This "dual-tasking" approach is effective because it forces the brain to manage motor and cognitive functions at the same time—a process often disrupted by a concussion (7).
What the Data Tells Us: We compare his post-concussion results to his baseline COP data from pre-season. The analysis shows a 35% increase in his mean sway velocity during the dual-task test. This tells us his brain may be struggling to allocate resources efficiently, and his automatic postural control is still compromised.
This finding provides a clear, data-driven reason to proceed with caution, protecting him from a potentially catastrophic second injury. The coach can then use regular COP testing to monitor his neurological recovery, providing an objective milestone for a safe return to the field.
As COP analysis becomes more integrated into clinical practice, it's exciting to see how other technologies are pushing the boundaries of healthcare. For instance, innovations like virtual reality for medical training are creating new ways for professionals to practice and perfect complex assessments, including those involving patient balance and mobility.
Looking Beyond the Basics: Advanced and Developmental Applications
The center of pressure is far more than just a tool for standard balance tests in adults. Its principles are being applied in fascinating ways across specialized fields, giving us incredible insights into everything from a child's motor development and an athlete's power to even animal biomechanics. It's a testament to just how versatile this metric really is.
From the moment a child takes their first step, COP analysis gives us a powerful, objective window into their developmental milestones. It lets pediatric therapists move past subjective notes and actually quantify how a child's neuromuscular system is maturing.
Tracking the First Steps of Life
Watching an infant go from a wobbly new walker to a confident toddler is a story of rapidly evolving postural control. This entire journey is captured in their center of pressure data, offering a look into how the brain and body team up to master the complex skill of walking upright.
Research shows that as children transition from new walkers (around 12-14 months) to more experienced walkers (18-24 months), their postural control improves dramatically. This maturation is reflected in a significant reduction in their overall sway area and sway velocity, which correlates with fewer stumbles and falls. These objective measurements provide a quantitative look at this key developmental phase (8). You can dive deeper into these developmental findings on Plos One.
For clinicians, these hard numbers are invaluable. They can spot potential developmental delays earlier and have concrete data to show that their interventions are working.
Unlocking Peak Athletic Performance
In elite sports, the smallest inefficiency can be the deciding factor between winning and losing. This is where coaches and performance specialists use center of pressure analysis—to dig into explosive movements and find subtle asymmetries that might be leaking power or, worse, setting an athlete up for injury.
Think about a basketball player launching into a vertical jump or a golfer unleashing a powerful drive. The COP trace tells the story of exactly how they generate force from the ground up and transfer it through their body.
- Jumping Analysis: For a max vertical jump, the ideal COP trace shows a quick backward shift to load the hips, then a rapid, straight-line forward shift at takeoff. If there's a wobble or a significant difference between the left and right foot, it points to muscle imbalances or compensation patterns that could limit jump height and increase the risk of a poor landing.
- Rotational Power: In sports like golf or baseball, the COP path reveals the efficiency of weight transfer. A professional golfer’s COP will glide smoothly from their back foot to their front foot, creating a powerful rotational whip. A less-skilled player's trace might show they shifted too early or never fully got their weight across, which can lead to a loss of power and accuracy.
By making these ground reaction forces visible, coaches can give feedback that truly clicks. An athlete might not feel a slight imbalance, but seeing it laid out on a screen makes the abstract idea of "using the ground" concrete and immediately actionable.
Applications Beyond Human Movement
The core principles of COP are so universal they've even found a place in veterinary medicine. Just like with people, COP data offers an objective way to assess gait and lameness in animals, especially high-performance horses and working dogs.
Vets use pressure-sensitive walkways to analyze an animal's gait, picking up on subtle weight-bearing issues that are impossible to see with the naked eye. This data is a game-changer for diagnosing lameness, tracking recovery after an operation, and creating targeted rehab plans. It helps answer critical questions, like whether a racehorse is loading its limbs evenly at a full gallop or if a dog's arthritis is causing it to favor one leg.
From a baby’s first shaky steps to an Olympian's explosive leap, the center of pressure gives us a shared language to understand movement, balance, and the constant conversation happening between a body and the ground beneath it.
Common Questions About Center of Pressure Analysis
As you start bringing center of pressure analysis into your practice, you're bound to have some questions. It's one thing to understand the theory, but putting it into practice means dealing with new protocols, tricky interpretations, and figuring out where it fits best. Let’s tackle some of the most common questions head-on to help you use COP measurements with confidence.
How Can I Standardize My Testing Protocols for Reliable Data?
Consistency is everything. Without it, you cannot reliably track progress or compare results over time if your testing method changes. Standardizing your protocols is all about minimizing the variables that can affect your measurements, ensuring the changes you see are real improvements in your patient, not just noise in your data.
A good starting point is a widely accepted protocol for static balance: a 30-second trial with clear, simple instructions (1). From there, lock down the details.
Here’s what to focus on for a repeatable process:
- Foot Placement: This has to be the same every single time. A simple trick is to trace the patient's feet on a paper overlay you place on the force plate. Another option is using tape or markers to guide placement.
- Arm Position: Pick one and stick with it. Whether it's arms crossed over the chest or resting at their sides, consistency is what matters.
- Gaze Direction: This one's easy to forget but has a big impact. Have the patient focus on a fixed spot on a wall at eye level, about 3-5 meters away. This stops their eyes from wandering, which can subtly change their sway.
- Instructions: Use the exact same phrasing every time. Simple, clear commands like "Stand as still as you can" leave no room for misinterpretation.
By controlling these factors, you dramatically boost the reliability of your COP data. It becomes a powerful tool you can trust for tracking changes over weeks or months.
What Are the Most Common Mistakes When Interpreting COP Results?
The biggest trap is looking at a single metric in a vacuum. A high path length on its own does not necessarily mean "bad balance." The center of pressure data tells a story, and each metric is just one piece of the puzzle.
It’s a classic mistake: failing to see how the metrics relate. A long path length paired with a tight, small sway area might actually show a very active and effective balance strategy. On the flip side, a very short path length within a huge sway area could signal a dangerously slow or passive system that isn't correcting itself properly.
Another common oversight is not comparing different conditions. The real insight often comes when you compare an eyes-open test to an eyes-closed one. The difference between the two, sometimes called the Romberg quotient, tells you a great deal about how much a person relies on their vision for stability. A massive increase in sway when the eyes are closed is a strong indicator of over-reliance on vision.
Lastly, don't forget the person standing on the plate. Age, fitness level, and their specific injury or condition all change what "normal" looks like. Interpreting the data without that clinical context is how you end up with the wrong conclusions.
Can COP Analysis Be Used for Assessments Beyond Standing Balance?
Absolutely. While static balance is its bread and butter, center of pressure is incredibly versatile. It can give you powerful insights into dynamic and functional movements, which is where things get really interesting for sports performance and advanced rehabilitation.
Think about a golf swing. COP analysis can show exactly how an athlete shifts their weight to generate power. Studies of elite golfers show a signature pattern: they'll shift a significant amount of pressure to the back foot on the backswing, then smoothly transfer it forward just before impact (9). An amateur’s COP trace might look jerky or inefficient, providing a clear explanation for their lack of power or accuracy.
Here are a few other ways to use it:
- Jumping and Landing: Analyzing the COP during a vertical jump can reveal asymmetries in how an athlete produces force and absorbs impact on landing—critical for flagging injury risk.
- Gait Analysis: With long force plates or pressure-sensing walkways, you can track the COP during walking to spot subtle gait issues that the naked eye would completely miss.
- Functional Tasks: You can even assess COP during a basic sit-to-stand. This gives you objective data on how well a patient can perform a fundamental daily activity.
By thinking beyond the simple standing test, you can unlock a whole new layer of information about how your patients and athletes truly move.
At Meloq, we believe in giving clinicians the power to see what’s really happening. Our ecosystem of tools, like the EasyBase force plate, is built to provide objective, accurate data that makes complex ideas like center of pressure easy to understand and use in any clinical setting. See how our solutions can help you make more confident, data-driven decisions at https://www.meloqdevices.com.
References
- Ruhe A, Fejer R, Walker B. The test-retest reliability of centre of pressure measures in bipedal static task conditions - A systematic review of the literature. Gait Posture. 2010;32(4):436-45.
- Winter DA. Human balance and posture control during standing and walking. Gait Posture. 1995;3(4):193-214.
- Horak FB, Nashner LM. Central programming of postural movements: adaptation to altered support-surface configurations. J Neurophysiol. 1986;55(6):1369-81.
- Era P, Heikkinen E. Postural sway during standing and unexpected disturbance of balance in random samples of men of different ages. J Gerontol. 1985;40(3):287-95.
- Melzer I, Kurz I, Tsedek I, Oddsson LI. Fall risk assessment in a clinical setting: comparing the Activities-specific Balance Confidence (ABC) scale, the Berg Balance Scale, the Timed Up & Go (TUG) test, and the Functional Reach (FR) test. J Gerontol A Biol Sci Med Sci. 2009;64(11):1199-204.
- Paterno MV, Schmitt LC, Ford KR, Rauh MJ, Myer GD, Huang B, Hewett TE. Biomechanical measures during landing and postural stability predict second anterior cruciate ligament injury after anterior cruciate ligament reconstruction and return to sport. Am J Sports Med. 2010;38(10):1968-78.
- Broglio SP, Sosnoff JJ, Rosengren KS, McShane K. A comparison of balance performance: dual-tasking in healthy and concussed individuals. Med Sci Sports Exerc. 2009;41(5):1018-25.
- Steindl R, Kunz K, Schrott-Fischer A, Scholtz A. Effect of age and sex on maturation of sensory systems and balance control. Dev Med Child Neurol. 2006;48(6):477-82.
- Ball KA, Best RJ. The golf swing: a comparison of the top 250 male and female golfers. J Sports Sci. 2012;30(11):1135-42.

Featured Product
EasyBase Force Plates
Portable dual force plate system for jump testing, balance & rehab. No subscription fees.
Learn More