
A Guide to the Average for the Sit and Reach Test: Understand Your Flexibility
Team Meloq
Author
When you’re looking at flexibility, the average for the sit and reach test provides a benchmark that puts individual scores into perspective. While scores vary, many normative data sets show results typically landing in the 24-30 cm range for men and 27-33 cm for women. Pushing into "excellent" territory often means hitting scores above 36 cm for men and 39 cm for women (1).
Understanding the Sit and Reach Test Score
The sit and reach test is a staple in physiotherapy, sports conditioning, and fitness assessments for a reason. It gives us a straightforward measure of hamstring and lower back pliability—two areas that are critical for good posture, efficient athletic movement, and preventing common injuries.
But a raw score is just a number until you give it context. To make sense of it, we have to compare it against established benchmarks. These benchmarks, known as normative data, are built from testing large groups of people, which allows us to see exactly where an individual’s flexibility stands in relation to their peers.
What Do the Numbers Mean?
The first step in using this test effectively is knowing what separates an "average" score from an "excellent" one. These ratings aren't arbitrary; they’re based on data that helps clinicians spot potential mobility issues before they become bigger problems.
Given that an estimated 8.4% of the global population experiences low back pain, having a clear understanding of lower back and hamstring flexibility is more important than ever (2). Knowing where you or your client lands on this scale can directly inform a targeted mobility program.
This simple chart breaks down the scores for men and women, showing the typical ranges for average and excellent flexibility.
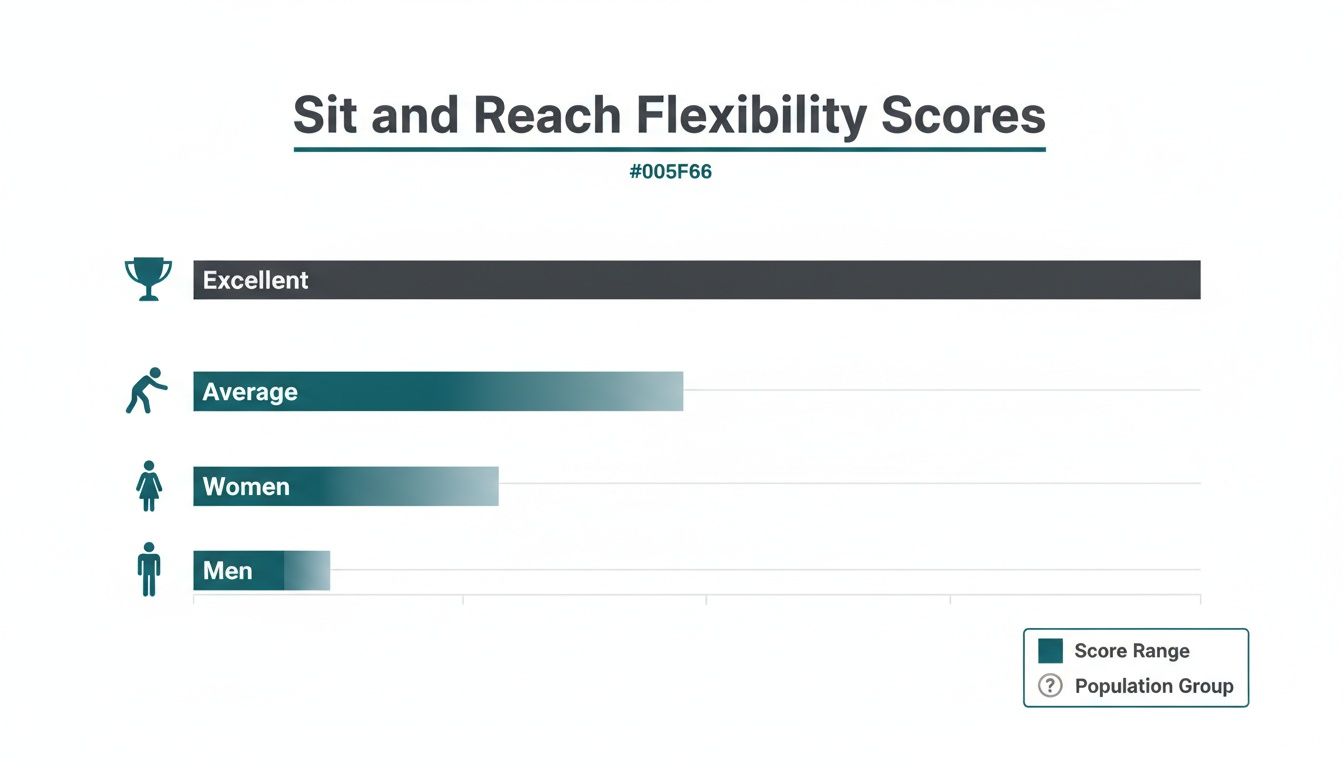
As you can see, women generally score higher than men in both the average and excellent categories, which is a well-documented physiological difference.
To make things even clearer, here’s a quick reference table with the numbers.
Sit and Reach Test Normative Data for Adults (Centimeters)
This table provides a simple breakdown of sit and reach scores for adult men and women, based on widely accepted normative data.
| Rating | Men (cm) | Women (cm) |
|---|---|---|
| Excellent | > 36 | > 39 |
| Above Average | 31-36 | 34-39 |
| Average | 24-30 | 27-33 |
| Below Average | 19-23 | 21-26 |
| Poor | < 19 | < 21 |
These values help clinicians and trainers quickly classify flexibility levels and set realistic goals for improvement.
Why Do Scores Vary So Much?
It's crucial to remember that these numbers aren't set in stone. A handful of factors can easily influence someone's score on any given day, which is why a single test should always be viewed as part of a much larger picture.
A sit and reach score is a snapshot in time, not a permanent label. Factors like a person's warm-up, time of day, and even their unique body proportions—such as arm-to-leg length ratio—can significantly impact the result.
This is where a clinician's expertise comes in. While the normative data gives us a valuable starting point, the interpretation is what truly matters. The goal isn't just to chase a high number; it's to understand what that number says about an individual's functional movement and overall musculoskeletal health. A "below average" score isn't a failure—it's a signal to focus on specific mobility work that can reduce injury risk and boost performance in both sports and daily life.
Why Hamstring and Lower Back Flexibility Matters
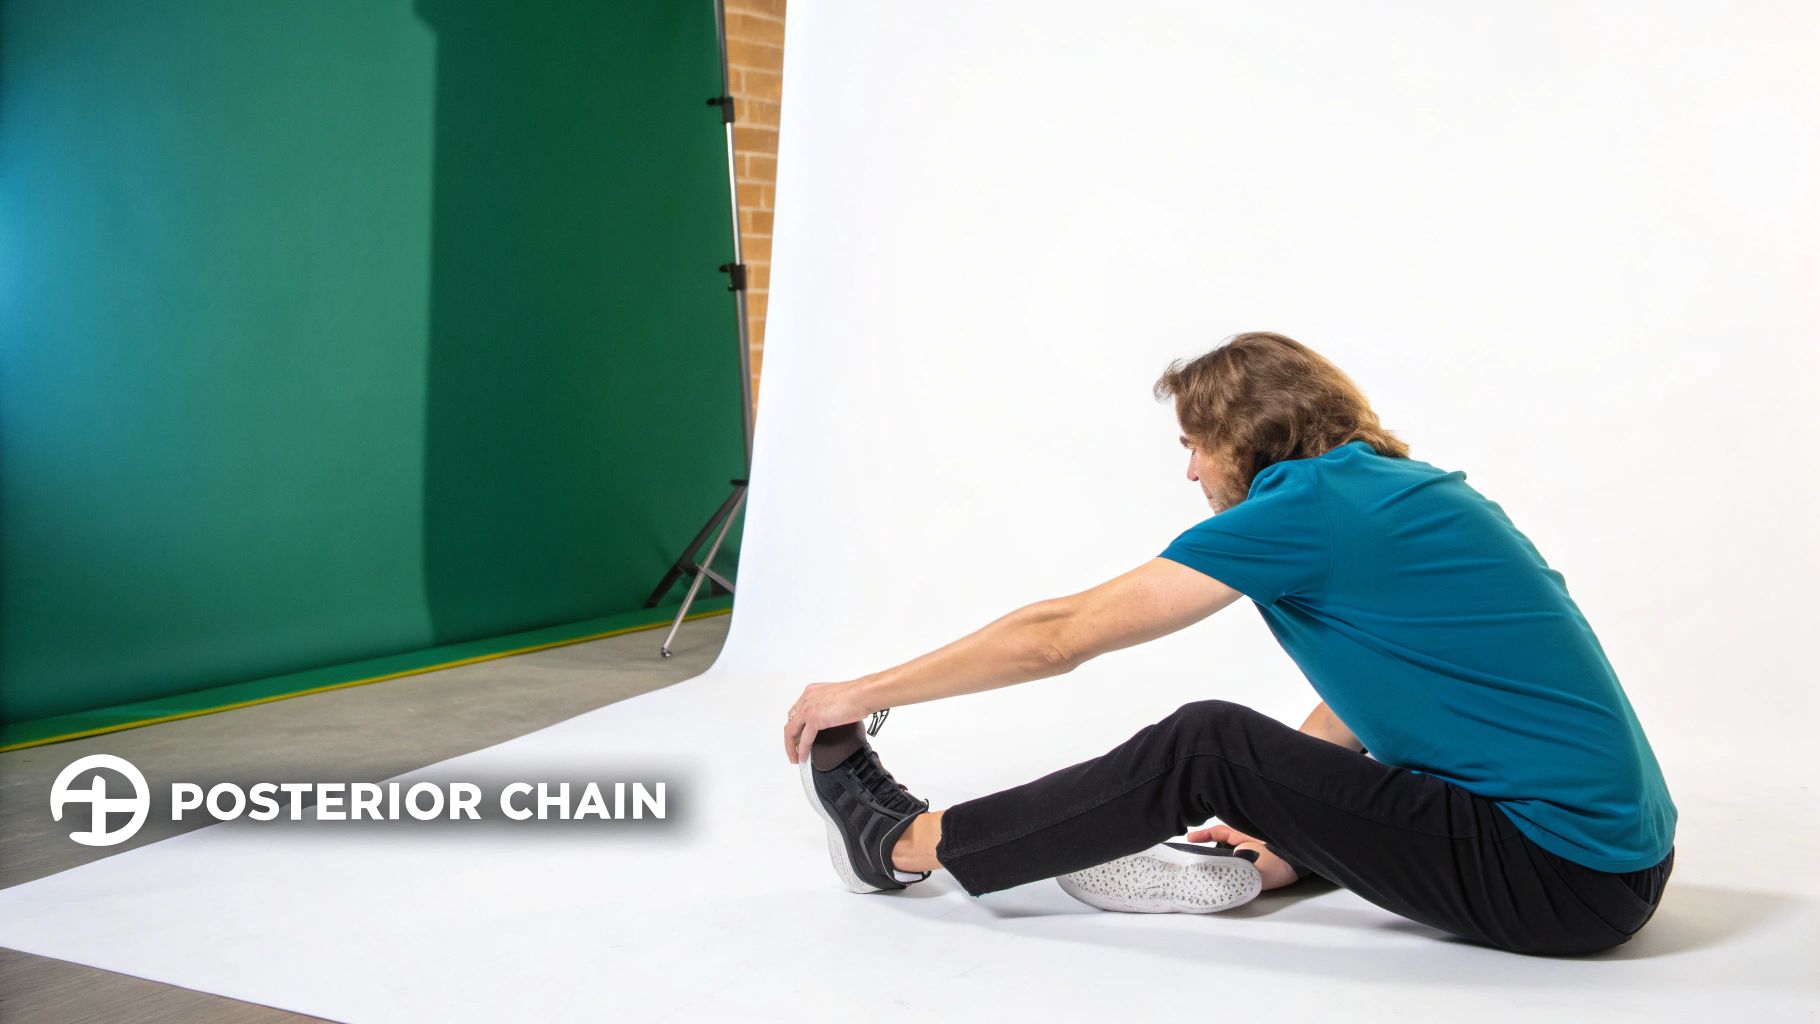
When you perform a sit and reach test, you’re getting more than just a number. You're capturing a valuable snapshot of the health and mobility of your entire posterior chain—that interconnected system of muscles running down the back of your body. The test specifically puts the spotlight on your hamstrings and lower back, two areas foundational to everyday movement and athletic performance.

Picture this posterior chain as a series of connected bands. If one section, like the hamstrings, gets too tight, the tension doesn't just stay there. It pulls on the neighboring "bands," creating a ripple effect of strain that can travel right up into the lower back and pelvis.
This interconnectedness is exactly why a simple forward reach can reveal so much. The test is a window into a dynamic system where flexibility in one area directly supports the health of another.
The Link Between Tight Hamstrings and Low Back Pain
In physiotherapy and sports medicine, the relationship between hamstring tightness and low back pain is well-established. When your hamstrings are inflexible, they can pull the pelvis into a backward tilt, a position known as a posterior pelvic tilt. This tilt flattens the natural, healthy curve of your lumbar spine, putting additional stress on the vertebrae and the muscles trying to support them.
Over time, this mechanical strain may contribute to discomfort and chronic pain. In fact, many cases of non-specific low back pain can be linked back to poor hamstring mobility.
A study in the International Journal of Sports Physical Therapy found a significant correlation between decreased hamstring flexibility and the presence of low back pain in a population of young, active adults (3). This drives home the sit-and-reach test's value—it’s not just a flexibility measure, but a potential screening tool to flag individuals who might benefit from a targeted mobility program.
By identifying this connection early, clinicians and coaches can implement stretching programs to ease that tension before it contributes to a chronic problem.
How Flexibility Impacts Posture and Performance
Beyond just preventing pain, good hamstring and lower back flexibility is critical for maintaining solid posture and hitting peak athletic performance. When the posterior chain is tight, the body is forced to compensate. For instance, someone with tight hamstrings might round their lower back excessively when bending over, putting unnecessary strain on their spinal ligaments.
This compensation isn't just for simple daily tasks. In sports, it can be a performance limiter, leading to:
- Decreased Power Output: An athlete with a restricted range of motion can't move through the full sequence needed for powerful actions like jumping or sprinting.
- Inefficient Technique: Tightness can alter proper form, forcing an athlete to rely on less efficient muscles and burn through energy faster.
- Elevated Injury Risk: When the big, primary muscles can't do their job because of tightness, the body may overload smaller, stabilizing muscles. That can be a recipe for strains and other injuries. We've explored practical strategies on how to prevent hamstring injuries in another article.
At the end of the day, the sit-and-reach test provides far more than just a score. It offers critical insights into functional movement, postural health, and athletic readiness. It's a foundational assessment that helps us understand why a client might be in pain or hitting a performance wall, pointing us toward effective, targeted solutions.
References
- American College of Sports Medicine. ACSM's Guidelines for Exercise Testing and Prescription. 11th ed. Philadelphia: Wolters Kluwer; 2021.
- GBD 2017 Disease and Injury Incidence and Prevalence Collaborators. Global, regional, and national incidence, prevalence, and years lived with disability for 354 diseases and injuries for 195 countries and territories, 1990-2017: a systematic analysis for the Global Burden of Disease Study 2017. Lancet. 2018 Nov 10;392(10159):1789-1858.
- Sadler S, Cassidy S, Peterson B, Spink M, Chuter V. The correlation between hamstring flexibility and pelvic tilt in asymptomatic and symptomatic individuals with low back pain: a systematic review. Int J Sports Phys Ther. 2019 Aug;14(4):522-536.
How to Perform the Sit and Reach Test Accurately
To get a meaningful average for the sit and reach test score, consistency is everything. Think of it like a science experiment—if you change the procedure each time, you can't really trust the results. A standardized protocol ensures that any change in the score reflects a genuine change in flexibility, not just a variation in how the test was performed that day.
This section breaks down the step-by-step process for administering the test correctly. Following these steps is the key to collecting accurate and repeatable data, which is the bedrock of effective progress tracking in both physiotherapy and performance training.
Setting Up the Test Environment
Before your client or athlete even sits down, the setup has to be spot on. A controlled environment eliminates the variables that can throw off the results.
- Find a Flat, Non-Slip Surface: You need a level floor where the sit-and-reach box won't slide around.
- Position the Box: Place a standard sit-and-reach box flush against a wall. This stops it from moving during the reach.
- Prepare the Participant: The individual needs to take their shoes off and sit on the floor. Their legs must be completely straight, with the soles of their feet flat against the face of the box. Knees should stay straight and pressed to the floor.
This initial positioning is non-negotiable. Even a small bend in the knees gives the hamstrings slack, which can artificially inflate the score and make the result invalid.
The Standardized Test Protocol
Once you’re set up, the execution has to be just as precise. We're trying to measure a controlled, maximal stretch—not a sudden, jerky lunge.
Here's the standard procedure:
- Hand Placement: The participant should stack one hand right on top of the other, keeping their fingertips perfectly aligned.
- The Reach: They should breathe out slowly while reaching forward as smoothly as possible along the top of the box. Bouncing or lunging is not permitted.
- The Hold: At the furthest point of the reach, they must hold that position for at least 1-2 seconds. This is when you'll record the score.
- Repeat for Accuracy: It's best practice to run three trials and take the best of the three scores. This accounts for any initial stiffness and ensures the final number is a true reflection of their current flexibility.
For personalized instruction and to ensure you're using the most accurate technique during fitness assessments, getting guidance from qualified gym trainers can be a huge help.
Key Takeaway: The "hold" is critical. A quick touch-and-go doesn't provide a true measure of static flexibility. The 1-2 second hold ensures the measurement reflects a stable end-range of motion, which is far more valuable for any clinical assessment. This is a fundamental concept when you learn how to measure range of motion for any joint in the body.
Common Mistakes to Avoid
Even with a clear protocol, small errors can creep in and sink the test's validity. As a practitioner, you have to watch out for these common slip-ups to make sure your data is reliable.
| Common Mistake | Why It's a Problem | How to Correct It |
|---|---|---|
| Bending the Knees | Instantly releases tension on the hamstrings, leading to a falsely high score. | Keep an eye on the knees and remind the participant to keep them flat against the floor. |
| Jerky or Bouncing Movements | This uses momentum instead of actual flexibility and can increase the risk of a muscle strain. | Instruct the participant to perform a slow, controlled exhale as they reach forward. |
| Leading with the Head | This encourages rounding of the upper back, not a true hip hinge and hamstring stretch. | Cue the participant to "reach with your chest" or "hinge from your hips" to get the movement right. |
What If You Don't Have a Box?
What happens when a standard sit-and-reach box isn't available? You can use a valid modification like the V-sit test.
For this version, you just need a measuring tape secured to the floor. The participant sits with their legs in a 'V' shape, heels placed on a line at a specific mark (e.g., the 15-inch or 38 cm mark), and reaches forward along the tape. While the raw scores might not match the box test directly, it provides a consistent way to track progress when equipment is limited. The key, as always, is using the exact same setup for every single test.
Interpreting Your Sit and Reach Test Results
Getting a number from the sit and reach test is the easy part. The real question is: what does that number actually mean? A score by itself is just data, but to turn it into a genuine insight, we need context.
Is a score of 25 cm fantastic for a 65-year-old man but a potential red flag for a 20-year-old female gymnast? Absolutely. This is precisely why we rely on normative data—it lets us compare an individual’s score to the average for the sit and reach test for people of similar age and sex.
This moves us past a simple pass/fail mindset. It helps clinicians and coaches figure out if a score signals a real mobility issue that needs work, or if it’s perfectly normal for that individual. Better context leads to much smarter decisions in training and rehabilitation.
Age-Related Flexibility Trends
Our flexibility isn't static; it naturally changes as we age. Most children are incredibly flexible, but scores often decrease during the adolescent growth spurt as bones may grow faster than the surrounding muscles and connective tissues can adapt.
As we reach adulthood, flexibility tends to level off and then, if we don't actively work on it, begins a slow decline. This is a normal part of aging tied to changes in our muscle tissue and collagen. The good news? This decline can be dramatically slowed, or even reversed, with consistent mobility training.
A large 2023 cross-sectional study involving nearly 20,000 individuals found that men's sit and reach scores tended to decline after early adulthood, whereas women's scores remained more stable for longer before declining (1). This highlights how age affects the sexes differently, making age-specific benchmarks essential for a fair assessment.
To give you a better picture, here’s a look at how the average for sit and reach test scores tend to shift across different life stages.
Sit and Reach Averages by Age Group (General Population)
The following table illustrates the typical progression of sit and reach scores across different life stages, helping clinicians contextualize patient results.
| Age Group | Average Score Range (Men, cm) | Average Score Range (Women, cm) |
|---|---|---|
| Children (6-12) | +2 to +10 | +4 to +12 |
| Adolescents (13-19) | 0 to +8 | +3 to +10 |
| Young Adults (20-39) | -1 to +7 | +2 to +11 |
| Middle-Aged Adults (40-59) | -3 to +5 | 0 to +9 |
| Older Adults (60+) | -6 to +3 | -2 to +7 |
Note: These are general estimates. Actual scores can vary based on the specific test protocol and the population being measured.
Seeing these trends helps us set realistic expectations and create age-appropriate mobility goals for clients and patients.
Understanding Sex-Based Differences in Scores
If you look at the data, one thing becomes clear: females, on average, score higher on the sit and reach test than males across nearly every age group. This isn’t a fluke; it comes down to some fundamental anatomical and physiological differences.
The structure of the pelvis is a significant factor. The female pelvis is typically wider and shaped differently, allowing for a greater degree of anterior tilt—that forward-tipping motion of the hips you need for a deep forward bend. It’s a built-in mechanical advantage. On top of that, hormonal factors can also influence the laxity of ligaments and connective tissues, sometimes increasing the available range of motion.
Recognizing these inherent differences is non-negotiable for an accurate interpretation. Comparing a male client’s score against female norms would be misleading and could create unnecessary concern or unrealistic goals. That’s why using separate normative data tables for males and females is the standard for any professional flexibility assessment.
Beyond Norms: The Clinical Perspective
While normative data gives us a crucial baseline, a skilled practitioner knows that a test score is just one piece of the puzzle. The average for the sit and reach test is a screening tool, not a diagnosis. It points us in the right direction and prompts us to ask more questions.
For instance, a low score might mean tight hamstrings, but it could also be influenced by lower back stiffness, unique body proportions (like shorter arms), or even just improper technique during the test.
The real value comes from blending the objective number with sharp clinical reasoning. For reference, fair-to-average scores for adults (without a warm-up) often hover around -1 to +24 cm. While some protocols show excellent scores surpassing 46.5 cm for males and 45.5 cm for females, we also have to consider what the test is truly measuring.
A 2014 meta-analysis found that the test's correlation with true hamstring flexibility averaged between r = 0.46-0.67 (2). This confirms it's a moderately strong indicator, but not a perfect one. You can discover more insights about sit and reach test protocols and what they measure to deepen your understanding.
References
- Měkota K, Valenta M, Cuberek R. Sit-and-reach test: A reference study on a large sample of the Czech population aged 18-93 years. Int J Environ Res Public Health. 2023;20(3):2662.
- Mayorga-Vega D, Merino-Marban R, Viciana J. Criterion-related validity of the sit-and-reach tests for estimating hamstring and lumbar extensibility: a meta-analysis. J Sports Sci Med. 2014 Feb 1;13(1):1-14.
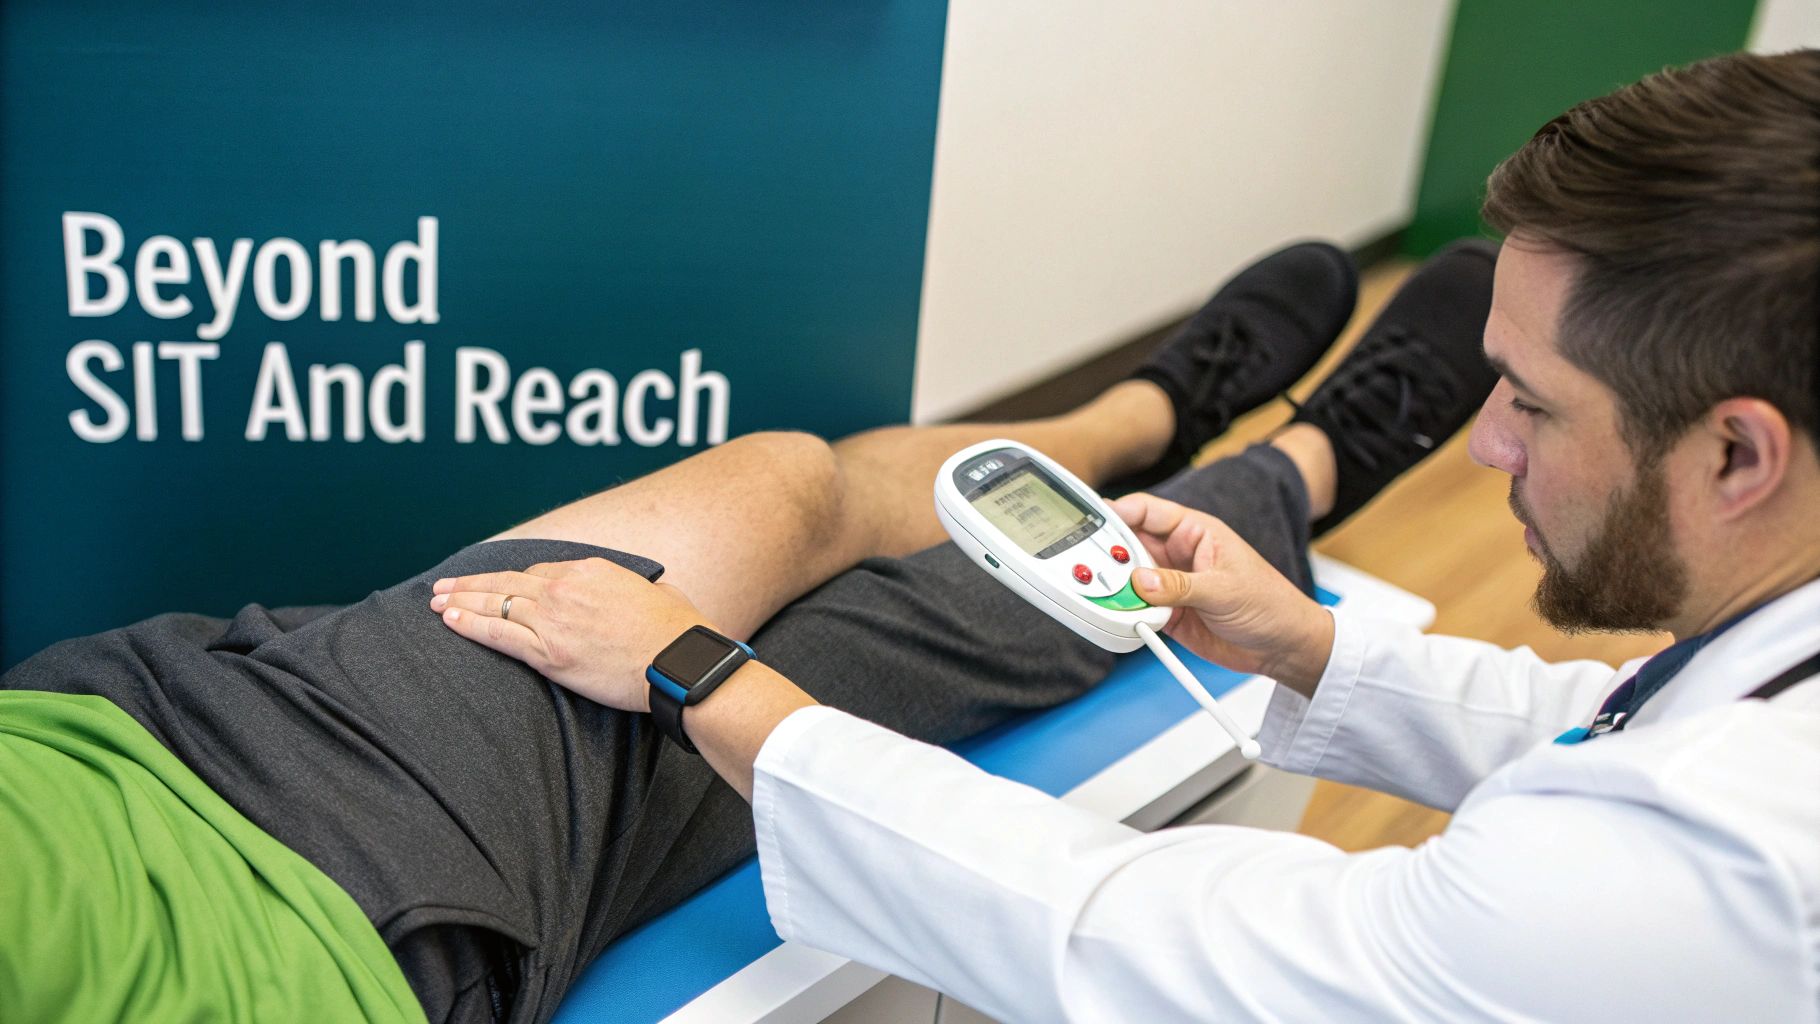
Looking Beyond the Sit and Reach Test
While the sit and reach test gives us a valuable, functional snapshot of the posterior chain, it has its limits. Think of it like a wide-angle camera lens—you get a great overall picture, but you can't zoom in on the specific details. A low score tells you something is tight, but it can't distinguish if the primary culprit is the hamstrings or stiffness in the lower back.
That distinction is critical for any clinician or performance coach. Is the problem muscular, or does it come down to spinal joint mobility? The answer completely changes how one might approach treatment. To get that level of detail, we should pair the sit and reach with more targeted tools that can isolate and measure the individual parts of the movement chain.
Isolating Variables with Precision Tools
This is where modern digital instruments come in, letting us shift from a general screening to a specific diagnosis. Instead of just knowing that a restriction exists, we can pinpoint exactly where it is and measure it with hard data. This takes the assessment from a simple pass/fail to a much deeper analysis.
Two key tools help us build this more comprehensive picture:
- Digital Goniometers: These devices provide a precise way to measure joint angles. For hamstring length, a clinician can perform a passive straight leg raise (PSLR) and use a digital goniometer to get a measurement that's accurate to a single degree. This isolates hip flexion from the lower back, giving you a clear, objective number for hamstring extensibility.
- Digital Dynamometers: Flexibility is only half the story; strength is the other side of the coin. A digital dynamometer lets us measure the force output of key muscle groups like the hamstrings, glutes, and core stabilizers. Weakness in these areas can often contribute to the same postural problems and pain we associate with poor flexibility.
By combining these targeted measurements, we build a much richer, more complete understanding of a person's movement health.
A low sit and reach score combined with a poor straight leg raise measurement points a clear finger at hamstring tightness. But what if the straight leg raise is fine, yet the sit and reach score is still low? That tells us the limitation is more likely coming from the lumbar spine. This is the kind of diagnostic clarity that leads to far more effective, targeted treatment plans.
Building a Complete Functional Profile
The goal isn't to replace the sit and reach test, but to build on it. By integrating these different assessments, we can create a robust functional profile that is far more insightful than any single test on its own. You can learn more about how different tests work together to create a full picture in our guide to the Functional Movement Screening test.
This integrated approach allows practitioners to:
- Develop Targeted Interventions: Instead of just handing out generic hamstring stretches, a clinician can confidently assign exercises aimed at the true source of the limitation—be it muscular tightness, joint stiffness, or a lack of core strength.
- Objectively Track Progress: Digital tools give us repeatable, objective data. Seeing a goniometer reading improve by 10 degrees or a dynamometer reading increase by 15% isn't just encouraging; it's concrete proof that the plan is working. This is valuable for client motivation and for validating a clinical strategy.
- Enhance Clinical Reasoning: By connecting the dots between data from multiple tests, clinicians can uncover complex movement patterns and compensations that a simple screening might miss.
Ultimately, by looking beyond just the average for sit and reach test and bringing precise digital measurements into the mix, we get much closer to a truly personalized approach to movement health. We can ensure that every intervention is as targeted and effective as possible.
Is the Sit and Reach Test Reliable and Valid?
For any assessment to be worthwhile in a clinical or performance setting, it must be trustworthy. That trust boils down to two key ideas: reliability (is it consistent?) and validity (does it accurately measure what it claims to?). Think of it this way: a reliable test gives you the same result over and over again, while a valid test actually measures what you think it's measuring.
When it comes to consistency, the sit and reach test performs very well. As long as you follow the protocol—sticking to a standardized warm-up and giving clear instructions—the results are remarkably repeatable. If you test an athlete on Monday and then again on Tuesday (assuming no major training changes), their scores should be nearly identical.
How Reliable Are We Talking?
Research backs this up with strong data. The sit and reach test has exceptionally high test-retest reliability, with studies showing intraclass correlation coefficients (ICC)—a statistical measure of consistency—as high as 0.96 to 0.99 (1). In musculoskeletal testing, that’s considered excellent. This is why the average for sit and reach test data is so dependable when collected correctly.
But Does It Measure What We Think It Measures?
This is where the conversation about validity gets more nuanced. The sit and reach test is often presented as a measure of "hamstring and lower back flexibility," but the evidence shows it’s much better at assessing one than the other.
A 2014 meta-analysis confirmed the test has a solid link to true hamstring flexibility, particularly when compared to gold-standard lab tests (2). You can read the full research about these validity findings yourself. However, its correlation to actual lumbar spine mobility is considered weak.
So, what does this mean in practice? A low score is a good indicator of potential hamstring tightness. It is not, however, a reliable sign of a stiff lower back. The test is a fantastic screening tool, but it doesn't provide the whole picture on its own.
To get the most out of the test, in terms of both reliability and validity, one must adhere to the fundamentals every time.
- Use a consistent, standardized warm-up before every test.
- Give clear, simple instructions to the person being tested.
- Take a few measurements (three is standard) and record the best score.
Sticking to these steps ensures the data you collect is as dependable as possible, allowing you to make informed decisions and track progress with confidence.
References
- Hui SSC, Yuen PY. Validity of the modified back-saver sit-and-reach test: a comparison with other protocols. Med Sci Sports Exerc. 2000;32(9):1655-1659.
- Mayorga-Vega D, Merino-Marban R, Viciana J. Criterion-related validity of the sit-and-reach tests for estimating hamstring and lumbar extensibility: a meta-analysis. J Sports Sci Med. 2014 Feb 1;13(1):1-14.
Common Questions About the Sit and Reach Test
Even with a detailed guide, a few questions often come up. Let's tackle some of the most common points of confusion to help you put this information into practice.
Why Do Women Typically Score Higher Than Men?
It's one of the most consistent findings in flexibility testing: women generally outperform men on the sit and reach. This is not typically about who stretches more; it is rooted in fundamental anatomical and hormonal differences.
The female pelvis is generally shaped in a way that creates a mechanical advantage for bending forward at the hips (1). On top of that, hormonal factors can contribute to greater laxity in connective tissues. It's a trend observed across nearly every age group in large-scale studies.
How Quickly Can I Improve My Score?
You can certainly see an increase in your score in the short term. Just doing a thorough warm-up or spending a few days consistently stretching your hamstrings, glutes, and low back can lead to immediate, noticeable gains.
But those quick wins are often temporary. For lasting, functional improvements in your flexibility, you need a structured and consistent mobility program. The American College of Sports Medicine recommends holding static stretches for 10–30 seconds and repeating them 2–4 times each. To see real, sustained progress, you should be doing this at least 2–3 days per week (2).
A single good score after stretching is encouraging, but true improvement comes from making mobility a regular part of your routine. The goal is to create lasting changes in tissue length and the nervous system's tolerance to stretching.
Is a Poor Score Always a Cause for Concern?
Not necessarily, but it is a data point worth investigating. A low score might be due to an individual's unique anatomy, like having longer legs in proportion to their torso. However, it often points to muscular tightness that could increase the risk for issues like low back pain or hamstring strains.
The key is context. A low score needs to be interpreted as part of a complete musculoskeletal assessment. For an athlete who is pain-free and moving well, a poor score is far less concerning than for someone who is already dealing with pain or has obvious movement limitations.
References
- Bellew JW, Michlovitz SL, Tara-Colecio R. A comparison of the effects of gender and age on hamstring length in a convenience sample of asymptomatic subjects. Physiother Theory Pract. 2005;21(1):23-30.
- American College of Sports Medicine. ACSM's Guidelines for Exercise Testing and Prescription. 11th ed. Philadelphia: Wolters Kluwer; 2021.
At Meloq, we believe objective data is the foundation of effective physical therapy and performance coaching. Our digital goniometers and dynamometers let you move beyond general screenings and pinpoint the exact sources of limitation with repeatable, degree-perfect accuracy. Stop guessing and start measuring. See how our tools can elevate your practice by visiting https://www.meloqdevices.com.

Featured Product
EasyForce Digital Dynamometer
Handheld muscle strength testing with 99% accuracy. Used in 40+ peer-reviewed studies.
Learn More